Menu
Did you know that it’s wise to have grain stored and marketing done by the fourth of July nine times out of ten? Getting to grips with grain price trends is key for those in the farming commodities market. I base my knowledge on a deep dive into areas like crop plans, dealing with pests, using fertiliser, and prepping the soil.
Seasonal patterns in the U.S. show that corn prices hit their lowest during the fall harvest. This is when there’s a lot of corn, and the local demand isn’t high. The period from spring to early summer sees corn prices jump around a lot. Soybeans have a similar story, with their prices being weakest during the fall but improving later on.
Big outside factors also shape these trends, like the 2020 COVID-19 pandemic. This caused a shakeup, pushing corn and soybean prices up. Drought and a falling U.S. dollar were big reasons. Knowing about these outside influences is vital for smart choices in the grain market, understanding crop prices, and predicting future prices.
Grain price trends show the complex relationship between supply and demand in farming. They are affected by weather, how much grain the world makes, economic changes, and policies on trade. It’s fascinating to see how these things come together to set the prices of basic foods around the world.
Take corn for example. Its global production is expected to drop, which will really affect trade. At the same time, more corn will be used to feed animals, but less for other things. This change underlines just how detailed comprehending grain markets can be.
Looking at wheat, we expect a big increase in its global production for 2024/25. This rise is mainly due to bumper harvests in India and China, and better crops in the U.S. and Canada. Yet, Europe and the Black Sea area might actually make less wheat.
In the same period, we predict more wheat will be used for food, seeds, and industry. However, the world’s wheat stockpiles are set to get lower for the fifth year in a row. This shows the challenges in balancing supply and demand.
Egypt plans to buy the most wheat in 2024/25, around 12.0 million tons. On the other hand, Indonesia might buy less, while Bangladesh could purchase more than before because prices are down. Pakistan is likely to buy a lot less because they’re growing a record amount themselves.
The European Union might import less wheat due to fewer supplies from Ukraine. All these changes show how crucial it is to have a deep understanding of grain markets all over the world.
Altogether, the mix of these factors makes global grain prices exceedingly complex. Keeping track of these trends helps people make better choices and manage risks in the market. Understanding the key influencers is crucial for those involved in the dynamic grain market world.
Grain prices change a lot over the year. Knowing these changes well is key to smart grain selling. For example, in autumn, more grain is available, so prices usually drop.

When fall comes, the market floods with crops, making prices fall. Corn and soybean prices are usually at their lowest at this time. But, after harvest, the prices often get better. This seasonal grain price fluctuation is crucial for farmers and traders to understand.
Spring and summer bring lots of changes in the grain market. Prices can change a lot between spring and mid-summer. Farmers and traders need to keep a close eye on planting progress and crop health. Usually, soybean prices are highest in summer, before they drop for fall. Dry weather and droughts can really shake up these trends. So, knowing about harvest yield impact on prices matters a lot.
In 2020, things were different because of COVID-19. Between March and May, grain prices fell due to the pandemic. But, later on, crop prices rose due to dry weather and a weaker dollar. Problems with crop growth in South America also pushed up U.S. prices.
Here’s a table showing how grain prices change by season. It’s clear these trends are strong and stay the same over the years.
| Season | Corn Prices | Soybean Prices | Key Influences |
|---|---|---|---|
| Fall | Lowest | Lowest | Harvest glut |
| Winter | Strengthens | Strengthens | Post-harvest adjustments |
| Spring | Volatility | Volatility | Weather, planting progress |
| Summer | Peak in July | Mid to late summer peak | Crop conditions, demand |
The way grain prices shift throughout the year is a big help. It makes smarter to use pre-harvest marketing like forward contracts. These well-documented cycles for the past decades are so trusted. They’re vital for everyone in the grain market to rely on.
Grain prices change due to several key factors. The most critical are the weather and how much grain the world is producing. It’s key to know about these for a deep look into crop prices.
The weather hugely affects how much grains cost. Droughts, too much rain, or frosts can badly hit the amount of crops we can get. The United States has seen big jumps in corn and wheat crops. Corn’s per-acre amount jumped by 72% from ’65 to ’96, hitting 127.1 bushels. Wheat, on the other hand, went from nearly 30 bushels per acre in the mid-1970s to 37 by the ’90s. This shows us good weather helps grow more, which can lower prices.
How much grain is grown around the world impacts how much we have to buy. As an example, the U.S. made over 210 million metric tons of corn and 63.6 million metric tons of wheat from ’90 to ’96. Just corn sales made nearly $16 billion, with wheat bringing around $8 billion in the same time. So, when big grain-growing places do well, it affects the prices we see, too.
The COVID-19 outbreak and fighting in Russia and Ukraine are recent examples. Grains’ prices globally went up a lot in the early days of the pandemic. From December 2019 to February 2022, the cost of grains shot up by 73.5%. Then, with the Russia-Ukraine conflict, U.S. grain prices jumped by 24.1% in just four months. Wheat and corn saw the biggest increases, with 25.7% and 24.8% more expensive by June 2022. These situations show how world happenings can mix with our local grain markets.
To wrap up, deep crop price checks mean watching weather and how much grain we’re making worldwide. These points help us understand the up and down of grain prices. They also guide those dealing in farm goods on what moves to make in the market.
The COVID-19 pandemic greatly affected grain prices, causing chaos in the global agricultural market. By 2021, imports of agricultural goods had risen by 18.6%, hitting $193,771 million. This, along with other factors, has changed the farming world in significant ways.

Between March and May 2020, prices of corn and soybeans fell sharply. This was because the pandemic had lowered demand and created transport problems. However, growing droughts and a weaker US dollar helped soften these drops.
After the initial hit, the agriculture sector started to bounce back. Exports grew by 17.9% in 2021, hitting $185,394 million. Global commerce picked up, helping the market recover. Energy product exports also went up significantly, by 58.1%.
This resilience not only restored prices but also showed the markets’ strength in the face of challenges.
Here’s a table summarising the import and export changes in 2021:
| Category | 2020 (Million $) | 2021 (Million $) | Percentage Change |
|---|---|---|---|
| Agricultural Products Imports | 163,343 | 193,771 | 18.6% |
| Energy-Related Products Imports | 125,911 | 219,241 | 74.1% |
| Minerals and Metals Imports | 203,832 | 261,472 | 28.3% |
| Forest Products Imports | 44,580 | 61,064 | 37.0% |
| Commodities-Driven Sectors Imports | 537,666 | 735,547 | 36.8% |
The pandemic underscored the importance of flexibilty in the grain market. As we move forward, keeping a close eye on the market will be key.
When looking at grain markets, knowing the local basis is key. The local basis shows the difference between the price at the local market and the futures price. This difference is important in understanding grain pricing.
Now, during harvest, when there’s a lot of grain, the basis weakens. But, once the harvest is over and less grain is available, the local basis gets stronger. This means it’s a good time to sell grain from storage.
Take Southern Minnesota as an example. In early May, the corn basis was between $0.20 and $0.50 over the CBOT July futures price. By October, this changed to between $0.25 and $0.50 under the CBOT December futures price.
Also, soybean basis went from $0.10 under in May to $0.15 over July prices at plants. But, by October, it was $0.60 to $0.80 under November futures at grain elevators.
Watching these changes helps us understand the market better. For example, corn basis in the Southern Plains States can go over $1.00 per bushel above the July futures price. This shows how important local basis is in deciding when and where to sell grain.
Over six years, from 2015 to 2020, Southern Minnesota’s corn basis was usually $0.35 to $0.45 under December futures by late October. On the other hand, soybean basis was between $0.40 and $0.90 under November futures at harvest. This data emphasises how basis levels are linked to local supply and the need for deep analysis.
Price spreads, which is the difference in prices from where it’s bought to where it’s sold, help tell us about delivery needs. People in the industry can adjust transport plans by watching how basis changes. Barge freight information, like the Ohio River’s 375% base tariff rate, gives a clear picture of how transport costs affect prices.
In summary, knowing about the local basis is crucial. It helps in making smart selling choices. This can increase earnings for sellers and shippers alike by finding the best times and places to sell grain.
The US dollar’s strength greatly affects the prices of grains worldwide. This impacts how competitive these exports are and the demand for them. We’ll look into how this influence works, mainly in the economy of grain trading.
The strong US dollar changes how competitive grain exports are. In the past, when the dollar weakened, US grains became cheaper for overseas buyers. This boosted their demand. Notably, from early 2021 to mid-2022, even as global food prices surged by 30%, the dollar remained strong.
After Covid, the usual link between commodity prices and the US dollar changed. This shift troubles the grain trading economics. The US no longer mainly imports oil, but it’s also exporting now. This has had a big impact, making things more complex.
The strength of the US dollar usually means less demand for grains globally. This is because a strong dollar makes US exports more expensive. Despite this, both the dollar and grain market prices are rising at the same time. This leads to a very unusual situation.
Looking at past trends, higher commodity prices often came with a weaker US dollar. But the situation today is different. The strong dollar and high grain prices suggest bigger, more complex issues. These include things like the Federal Reserve raising interest rates to tackle inflation. This unusual scenario has kept the global demand for US grains very strong.
Understanding how the US dollar influences grain exports and demand gives us a key insight into grain trading. Analysts and stakeholders must watch currency movements closely. This helps them predict and adapt to changes reliably.
South America, including Brazil and Argentina, is key in the grain world. Knowing about their harvest times is important for predicting the US grain market changes.
In comparing South America’s harvests to the US, a big difference shows. Let’s look at maize. Argentina’s maize production is predicted to be 55 million tonnes in 2023/24. This is a big jump from last year. But, the US is seeing lower corn production because of tough weather. This big gap in production is causing noticeable changes in the US grain market.
| Region | Crop | Production Forecast | Change from Previous Year |
|---|---|---|---|
| Argentina | Maize | 55 Mt | +57% |
| US | Corn | – | – |
| Argentina | Soyabean | 50 Mt | +100% |
| Brazil | Soyabean | 156 Mt | -4% |
These differences require the US grain market to quickly adjust. Changes in Brazil and Argentina’s production affect whether they’re competing or working together with the US market.
The South American harvest season hugely impacts prices. For example, soybean prices might drop in the US during fall but then rise with the South American harvest in February. It’s a complex supply and demand dance. US farmers need to watch closely and pick the right time to sell.
In 2020, drought in South America reduced crops, raising US prices. This shows how weather in South America can cause big shifts in the US market. By watching South American harvest cycles, we can be ready for market changes and make smarter grain selling plans.
To make a good grain marketing plan, you need to plan carefully and think about your strategy. Using the University of Maryland Extension website helps a lot. It lets farmers set realistic prices and make solid marketing plans.
Talking about prices has to be the first thing in your plan. Farmers need to think about lots of costs, like seeds and labour, and fixed costs such as machines and rent. The website offers crop budgets and tools to figure these out.
It’s also key to know when prices tend to rise or fall. For corn, prices usually go up in the spring but then drop before the harvest. This kind of insight helps farmers set prices that make sense.
To sell grain well, it’s good to know about different ways to set prices. These methods include future contracts, options, and managing margins. The University of Minnesota’s advice can show you how to use these tools right.
Your plan must be able to change with the market. It’s smart to check and update your plan often. This approach helps it fit the market’s twists and turns. It also stops you from making big mistakes, like trusting prices too much or guessing market peaks.

Finally, it’s smart to set smaller goals, like aiming for a certain price for a part of your grain. And talk about your plan with other farmers to stay on track. This way, everyone can help keep each other focused.
Keeping an eye on crop prices with grain market news is vital. It lets you understand the agricultural commodities market better. To make smart choices, you need recent info. DTN gathers 36,000 to 40,000 bids daily from 4,200 buyers in North America. It covers grains like yellow corn and soybeans. This data is unmatched.
These bids are more than just numbers. They help create the DTN cash grain indexes and national basis levels. With this detailed info, market predictions are more precise. For serious grain traders, getting DTN’s daily updates is a must. It ensures you spot any important changes quickly.
DTN analysts use this data to shape the Six Factors market analysis. This analysis is key for knowing what’s happening now and guessing future trends. By keeping up with grain market news, you can react to sudden changes from weather, politics, and economics.
Having access to such detailed data is a major plus. It lets you make quick and smart decisions. This protects your profits and helps with long-term planning. Being well-informed gives you an edge in the market.
If you’re into keeping up with crop prices and the grain market, check out DTN’s daily grain bids often. This info is crucial for navigating the up-and-down world of grain trading. It keeps you ahead of the game.
| Commodity Type | Bid Volume | Importance |
|---|---|---|
| Yellow Corn | High | Basis for cash grain indexes |
| Soybeans | High | Critical for market analysis |
| Hard Red Winter Wheat | Medium | Key in national basis levels |
| Other Wheat Types | Medium | Integral to daily bids |
| Grain Sorghum (Milo) | Low | Part of diverse commodity analysis |
| Oil and Seed Sunflowers | Low | Supplementary data for trends |
In agricultural markets, it’s key to use different ways to predict prices. Two main methods are important – technical and fundamental analysis. They use different tools to make price forecasts more accurate.
Technical analysis looks at past market data, focusing on price and volume. This method identifies patterns to predict future prices. Various tools like moving averages, RSI, and Fibonacci levels help in this process.
But, technical analysis needs a lot of past data. Yet, agricultural markets are complicated by unpredictable factors. This can make technical analysis alone less reliable.
Fundamental analysis studies outside influences on the market. It considers economic indicators, supply and demand, as well as other factors. This helps in making clearer predictions.
| Factors | Impact on Prices |
|---|---|
| Supply and Demand | It shapes prices by adjusting to scarcity or abundance. |
| Climate and Policies | Factors like weather and government rules affect crop supply. |
| Labor and Growing Costs | These expenses affect prices when they change. |
Both technical and fundamental analyses are vital for price forecasting. By using insights from both, we can make better strategies. These strategies help us deal with market changes more effectively.
Models like regression, time series, and machine learning bring both methods together. They handle seasonality and errors but need accurate data to work well.
In conclusion, using both technical and fundamental analyses offers a deep insight into commodity prices. This approach deals well with the many challenges of agricultural markets.
Global trade policies greatly affect the agricultural field. They play a key role in setting grain prices worldwide. These policies include things like import taxes, export limits, and deals between different nations. They greatly affect how much grain is available and how much people want to buy. This directly links to the final prices of grain.
An example of these effects is the expected drop in global corn production. This will happen because of smaller harvests in places like Argentina, Ukraine, and the United States. Lower supply means there will be less corn to trade globally. Nevertheless, the need for corn, especially for animal feed, keeps growing. Despite this, the world is predicted to have slightly lower corn reserves. The extra corn in China and the U.S. won’t fully offset the reduced stocks in other major corn-growing countries.
Looking at wheat, we see how global trade policies shape the markets. There is a record amount of wheat being produced, but the trade and leftover stocks are expected to be lower. The reason for this is less need for wheat in big wheat-consuming places like Pakistan and the European Union. Still, countries like India, China, and Australia are producing more wheat to keep up. This helps balance out the drops in production seen in Europe, Russia, and the United Kingdom.
As for rice, there’s a predicted record-high production globally. This is thanks to bigger harvests in Asia. The increase in production matches a rise in rice-eating countries like India and the Philippines. Despite more rice out there, it might not travel far. Global rice trade is expected to stay the same. India looks set to remain the biggest rice seller, even with trading limits. Big rice stocks around the world, held especially in China and Vietnam, should also shape how the market moves.
A closer look tells us that each crop feels the trade policy effects in different ways. For example, global wheat production for 2024/25 is estimated at 798.2 million tons. This is a rise from the year before. Yet, consumption is not far behind, expected at 802.4 million tons. This shows a growing use of wheat in foods, seeds, and industry. Even with less wheat being used for animal feed, there’s strong demand in some countries. For instance, Egypt is expected to import a lot of wheat, showing the specific needs in various regions.
In the end, global trade policies have complex impacts on the agricultural markets. They affect grain prices in big ways. The changing conditions of corn, wheat, and rice point to the influence of trade rules. Import taxes, export bans, and international deals all shape what farmers grow, what traders sell, and what people buy around the world.
The agriculture world changes fast. It’s key for everyone involved to stay updated with the *grain market news update*. The latest news shows big changes in how much food, like corn and wheat, is made, sold, and used around the world. These changes affect the prices of these important commodities.
Last year, the amount of corn grown dropped in places like Argentina, Ukraine, and the US. This means there’s likely to be less corn to buy or sell. Despite this, the demand for corn used in livestock feed is expected to go up, while its use for other purposes might go down. Farmers are likely to have slightly less corn left over at the end of the season, except for in China and the US. In those countries, there could be more than usual. However, in places like Ukraine, India, and Brazil, there might be less of a corn surplus.
In terms of wheat, the world is expecting to see a record amount harvested. Yet, the amount of wheat being traded and stored is likely to be less than before. The record harvest comes from good crops in India, China, Australia, and the US, among others. This is offset by smaller harvests in parts of Europe and Asia. More wheat is expected to be used directly for food this year than last, reaching nearly 802 million tons. This increase in “Food Sector Use” happens worldwide.
Next year, in North America, particularly Canada and the US, more wheat is expected despite not-so-great weather. On the other hand, Europe and the Black Sea area may produce less due to weather. Also, global rice production is shooting for a new record. This is mainly thanks to bigger crops in places like Bangladesh, India, and Pakistan. So, more rice is expected to be grown and eaten around the world.
By the year’s end, corn supplies may stay low, especially in Ukraine, India, and Brazil. Yet, there should be more in China and the US. Wheat supplies are also expected to drop for the fifth year, with China keeping most of the world’s wheat stock. Additionally, Egypt will likely buy the most wheat globally. However, Southeast Asia and Pakistan might buy less because they’ll need less from abroad.
In the world of buying and selling these items, prices keep changing. Corn prices went down a bit, but soybeans are a little more expensive now. The US is still selling a lot to Mexico and China.
To understand cereal prices, we look at past grain prices and what might happen in the future. When we study old data, we find important trends and some surprises.
Looking back, grain prices have been up and down for many reasons. There’s a prediction that less corn will be grown, affecting the world’s supply. This is because of smaller harvests in countries like Argentina, Ukraine, and the US.
But, there’s a good side too. Wheat might actually increase in supply, thanks to more in places like India, China, and the US. Unfortunately, this boom won’t happen in the European Union, Russia, and the UK. We also expect a lot more rice this time, mainly from Bangladesh, India, Pakistan, and China.
In specific numbers, it’s said that we might see 798.2 million tons of wheat by 2024/25. This is over 10 million tons more than before. However, the amount of wheat we keep in storage is getting lower each year.
To guess what’s next for cereal prices, we look at today’s market and what experts think. They say we’ll have more cereal next year, around 2,846 million tonnes. This is slightly more than the year before – a 1.2 percent increase.
Rice is also going to be in abundance next season, hitting a record 529.2 million tonnes. This comes after a 0.7 percent bump from the last period.
When it comes to wheat, Egypt is set to import the most by 2024/25. They’re looking at 12.0 million tons of wheat because of past currency issues and the need to fill up their supplies. On a broader scale, the world will use 2.0 million tons more of wheat, hitting 802.4 million tons in 2024/25.
All these predictions are key for those in the cereal business. With an eye on the past and what’s ahead, they can plan better. This helps everyone prepare for the changes in cereal prices that are always around the corner.
Studying staple food price trends is key to understanding the agriculture market. As of May 16, 2024, prices show corn at $4.57-2 per bushel, soybeans at $12.17-0, and wheat at $6.63-4. These prices change due to many factors over time.
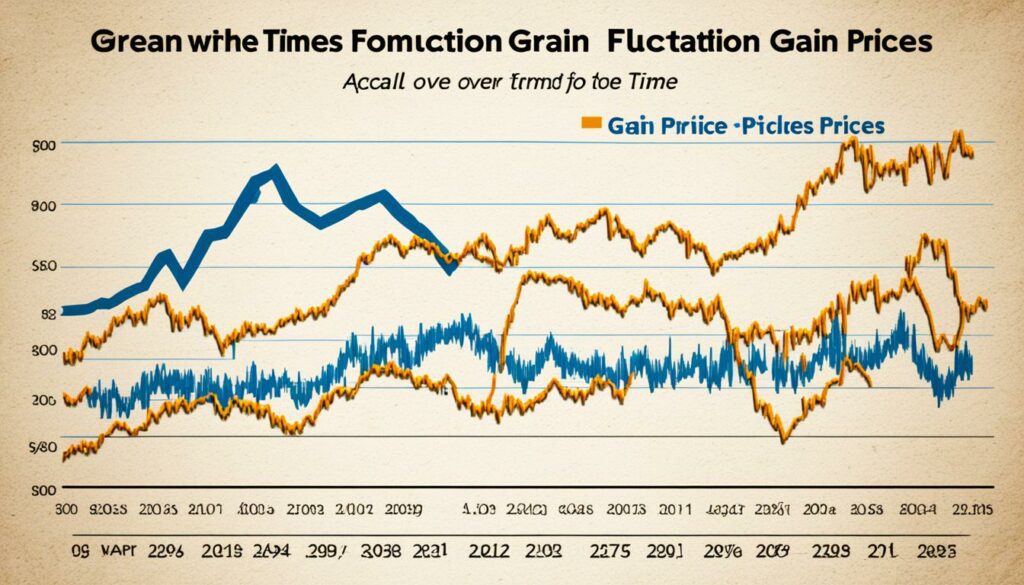
Soybeans have had big price swings. They rose by 14 to 16 cents on March 12, 2024, and by 37 cents on November 13, 2023. But they fell by over 18 cents on February 21, 2024, and by 15 cents on April 18, 2024. This shows why monitoring markets is crucial.
Corn prices are also fluctuating. After going up by 13 cents on May 10, 2024, they went down by 5 cents on May 16, 2024. They also dropped by 6 cents on August 30, 2023. This up and down shows why making smart choices is so important.
| Commodity | Price |
|---|---|
| Corn | $4.57-2 per bushel |
| Soybeans | $12.17-0 per bushel |
| Wheat | $6.63-4 per bushel |
| Cotton | $0.7624 per pound |
| Live Cattle | $177.375 per hundredweight |
| Lean Hogs | $101.625 per hundredweight |
Wheat prices have been going up lately. With a 20-cent increase on April 22, 2024, and more rises since. But the market can be unpredictable, with changes of 5 to 8 cents in Chicago wheat contracts. It’s crucial to always be watching and have a solid plan in place.
Grain prices are influenced by many things, from the time of year to what’s happening in the world. We’ve looked closely at these factors to understand the big picture of the farming economy.
Between December 2017 and 2019, grain prices rose by 14.9%. Other farm products only went up by 3.6%. The start of the pandemic in 2020 made grain prices jump even more. By February 2022, they had spiked by 73.5%.
The war in Russia and Ukraine made things worse, driving grain prices up by 24.1%. Even though prices dipped in July and August 2022, they were still higher than before the conflict began. This shows how tough but changeable the grain market is.
To understand grain prices, we must consider what’s happening locally and worldwide. By studying past and current data, we can try to predict what’s coming in the farming market. This information helps everyone involved make smarter choices.
Grain prices change for many reasons. The world’s weather, how much grain farmers grow, and the economy play big parts. Also, rules countries make about trading can shake up prices.
Seasons greatly affect how much grain costs. For example, lots of grain after the autumn harvest can make prices fall. But, unpredictable weather during the spring and summer can make prices jump up and down.
The COVID-19 pandemic shook up grain prices. At first, prices fell because the market was chaotic. But, later on, things like dry weather made prices go up again.
The local basis looks at local grain prices compared to future market prices. It’s usually low after harvest because there’s lots of grain. But then it gets better, which can be a good sign to sell the grain you’ve been storing.
A strong US dollar makes grain more expensive for other countries to buy. When the dollar drops, it’s cheaper for them, which can boost US grain sales. This shows how closely money values are tied to grain prices around the globe.
Grain from South America, like in Brazil and Argentina, can change US prices a lot. Their harvests, especially of soybeans, can either compete with or support US grain prices. This changes how the market works in the US each season.
To sell grain well, a solid plan is needed. It should have clear price goals and how to reach them. Keep an eye on history, latest trends, and future guesses to make a plan that works.
Staying updated on market news helps in making smart grain decisions. Things like weather, politics, and trade talks can change grain prices quickly. Knowing what’s happening can help traders and farmers adjust fast.
There are a few methods to guess where prices are going. Some check market behaviour in the past, while others look at economic signs and how much is being produced. Both ways help people guess what grain prices might do next.
Trade rules between countries can alter the prices of farm goods. These rules can slow down how grain moves around the world. This, in turn, can change how much it costs, affecting everyone in the grain trade.