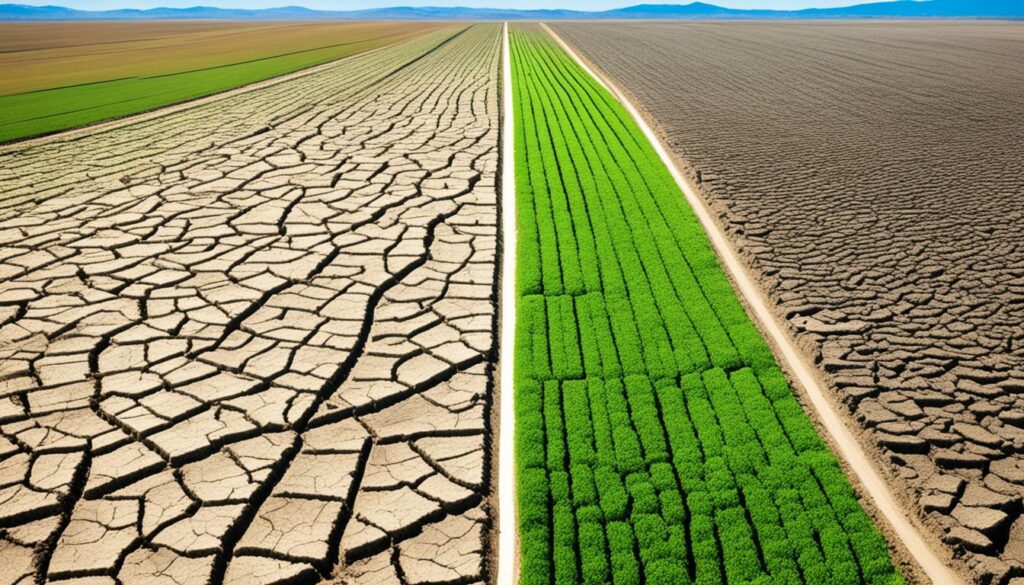
Did you know the farm share makes up 58% of the price of a dozen eggs in the shop? This big number shows how much farmers impact the prices we pay. For fresh meats, farmers get 30% to 50% of the price. But for cereal and bakery stuff, it’s only about 8%. The gap shows each farm product trends and market changes differently.
The farm share has been getting smaller since 1950, dropping from 41% to 17.4% in 2013. This shows how much the farming world has changed.
It’s vital for people in the industry to understand these numbers. It helps them plan and react to the changing market. They learn how changes in farm prices can take months to affect shop prices. This ripple effect can hit customers and farmers in different ways, showing the complex balance of the system.
Agricultural price indexes are key to understanding the farming economy’s health. They track prices of different farm products. This helps everyone involved to make smart choices.
The National Agricultural Statistics Service (NASS) creates these indexes. They show the money farmers get for their goods. NASS surveys about 100 types of crops and livestock in all states monthly. Prices for grains, oilseeds, and pulses are checked at 2,000 places. This method is used to keep track of changes in prices. It helps to understand the market and economy.
These indexes are vital as they tell us about price changes over time. NASS looks at the prices for all farm goods, crops, livestock, and more. They compare these prices to past periods like 1990-1992.
A long time ago, prices were measured differently. They used a simple way, setting a base like 1910-1914. NASS started surveys in March to find out about 450 important farm prices. This has shown how the system has grown and changed with the times.
Till today, the USDA tracks farm production values using these indexes. Other big agencies like the ERS and BEA also use this data. Even for insurance programs, these price indexes are crucial. They help us look into the past and understand today’s farming economy. They are vital for knowing both long-term and short-term trends.
Farm-to-retail price transmission shows how prices change from where food is grown to when you buy it. Many things can change how prices move. Knowing these changes helps to understand the big picture of selling food.
Prices change from where food comes from to where you buy it in different ways. This journey includes making food, moving it, and selling it. For instance, fresh meat can start at 30% to 50% at the farm, but cereal and bakery goods might only be 8%.
In the past, the part the farm gets from what you pay for food went down a lot. It used to be 41% in 1950, but by 2013, it was only 17.4%.
The way prices change is quite complex. Prices in stores don’t always quickly change to match farm prices. This is especially true when farm prices go down. For example, in 2008, when it was cheaper for farmers to sell, it took a long time for store prices to reflect that.
Looking into how much prices change over time, we see interesting things. For example, from 2019 to 2020, food prices in shops got 3.5% more expensive. But in 2016, they were down by 1.3%, which doesn’t happen often. Then, between 2006 and 2015, food prices got a lot more expensive. The change was 25.5% all over the country. Yet, some places like Pittsburgh saw bigger price hikes than Detroit.
Studies still note discrepancies in how effectively retail prices adjust to downward farm price movements, presenting ongoing challenges for price stability in agricultural markets.
So, seeing how farm-to-retail price transmission works is key. It helps anyone in this field understand how the market moves.
It’s vital for those in agriculture to know the parts of price indexes. These indexes show what’s happening in the market. They include many different products, giving a true picture of the market.
Index includes a wide range of agricultural goods. Every year, the NASS looks at prices for things like chemicals, machinery, and seeds. They also track monthly prices for 48 key items, from dairy to veggies, to give a full overview.
How each item is counted is key to these indexes. The Index of Production Items focuses on stuff like materials, services, and wage rates. This helps show what’s most economically important. For instance, prices for machinery and seeds are looked at deeply. This makes the index really represent what’s happening in the market.
These methods make sure the index reflects actual market changes. They also help set fair prices under some laws. By keeping track of prices and production details, decisions become more informed.
The prices in agriculture change for many reasons. These changes are important for people involved to know about. This helps them make good choices.
The amount of a crop (supply) and how much people want it (demand) affect prices. If there’s too much of a crop, its price might drop. Yet, if it’s not enough, the price might rise. For example, in 2007, there was a 4.7% increase in global grain production. This followed a 1.3% production decrease in 2006. Such changes can really make market prices move around. The interest of investors and speculation can also affect demand. Maize, for example, tripled in price from 2005 to 2008.
Bad weather can hurt farming and raise prices. Droughts, floods, or sudden climate changes can lower how much food we can grow. For example, from 2005 to 2008, palm oil prices jumped by 200% due to bad weather in production areas. Knowing what weather will be like is tough. So, how it changes prices can also be hard to predict.
Government policies are key in keeping agricultural prices steady. They can include money help, rules on prices, and laws about selling food to other countries. Take the USDA’s long-term forecasts. They show what might happen in the farm sector for 10 years. This helps farmers, traders, and others to plan ahead based on solid information. This planning helps keep the market balanced.
| Year | Commodity | Price Increase (%) |
|---|---|---|
| 2005-2008 | Maize | 200% |
| 2005-2008 | Wheat | 127% |
| 2005-2008 | Rice | 170% |
When we look at agricultural indices, we see big differences in what they cover and how they’re used. Major indexes from EU statistics and those for the UK show these differences clearly. They use different methods, and this affects the results.
The EU Agricultural Price Index (APIs) and the Producer Price Indexes stand out in agriculture. The EU APIs show a big picture with a steady method using the Laspeyres formula since 2015. This method keeps the data consistent across many years.
Producer Price Indexes look at what farmers actually earn after things like VAT are taken out. They look at sales to dealers, sales by farmers directly, and even processed goods. This gives a broad view of how much money comes from farming.
Diving deeper, the methods each index uses can be very different. The EU APIs stay the same because of the Laspeyres formula, but others like the Producer Price Index might change what they look at each year. They might adjust for things like which crops are in season.
For instance, the EU price indices keep the same basket of goods and weights, unless the importance of certain products changes. The total index for agricultural spending is based on costs from a fixed period.
| Index | Base Year | Components | Methodology |
|---|---|---|---|
| EU Agricultural Price Index (API) | 2015 | Crops, Livestock, Dairy | Laspeyres Formula |
| Producer Price Index | 2015 | Farm Outputs | Sales Values Excluding VAT |
| UK Agricultural Price Index | 2020 | Major Crops, Livestock Products | Base Year Index = 100 |
These details on how the indices are made and updated are crucial. Institutions like Eurostat often check and tweak how they calculate, showing that these indexes reflect real market changes precisely.
Tracking agricultural market trends is key for economic forecasting. Commodity price indicators provide deep insights for this task. They help us map farm product trends and spot major shifts in the market. This info is vital for anyone involved in commodity trading.

These indicators show how the prices of farm goods are changing. NASS monitors 100 crop and livestock prices across the US. They specifically look at grains, oilseeds, and pulse crops. Their work includes asking 2,000 buyers about prices every month.
The AMS also checks the prices of big livestock through daily reports. They get this data from packing plants and auctions. This effort keeps track of market changes, preparing us for what might come.
Using these indicators is big in forecasting the economy. NASS calculates indexes for 48 items to measure price changes. These help us see how prices move over time accurately.
These prices play a big role in valuing agricultural products. Bodies like the Federal Reserve use the info to understand market changes. The FFPI and FAOSTAT also give a broad look at prices worldwide. This all helps in making smart economic and policy decisions.
The use of commodity indexes in economic forecasts is crucial. They guide decisions on markets and policies. By studying these data, we can predict economic trends and plan for the future.
Understanding farm price trends is like taking a trip through time. You’ll see ups and downs in prices from the past to today. These changes are because of the market, policies, and the economy.
In the past, agricultural price movements have shown big changes. In 2020, prices at the store rose by 3.5%, and restaurant prices went up by 3.4%. The next year was even more dramatic. In 2022, food prices jumped by 9.9%. Groceries went up by 11.4%, and eating out increased by 7.7%. This rise continued into 2023. That year, food prices soared by 5.8%. This included a 5.0% rise for groceries and a 7.7% rise for eating out.
Recently, certain trends in farm prices have come to light. From February 2024 to March 2024, food prices increased by 0.6%. This shows prices keep going up. A year before, from March 2023 to March 2024, store prices rose by 1.2%, and restaurant prices by 4.2%.
In the upcoming year, 2024, food prices are expected to go up by 2.2%. Beef and veal prices could jump by 3.3%. Pork prices, on the other hand, are expected to remain the same. Predictions also include a 1.6% rise in poultry costs and 4.8% more for eggs. Dairy prices, however, are expected to drop by 1.6%.
This variety in price changes speaks to the complexity of the farm sector. Looking closely at both historical agricultural price movements and recent trend analysis in farming prices shows us how many factors play a role. The market is influenced by the economy, the environment, and government policies in a mix.
Agricultural and retail prices are closely connected. They show the journey from farm to table. This relationship helps us understand how prices in the food market are linked. For every item we buy, a share goes back to the farm.
For instance, nearly 58% of the price of a dozen eggs goes back to the farm. This core knowledge is vital for consumers, farmers, and retailers. It helps in making fair decisions about prices and shares in the food market.
From the 1950s to 2013, the farm’s share of our food money has gone down. It used to be 41%, but now it’s around 17.4%. This drop shows that costs after leaving the farm have increased a lot since the 1950s.
Moreover, when farm prices go up, retail prices rise quickly, but they don’t drop as fast. This means we notice price increases more than decreases. The USDA-NASS helps us track farm prices. It uses the Farm Price Index (FPI) for this.

In the 2007-2008 crisis and the COVID-19 pandemic, agricultural prices fell a lot. For example, from March to April 2020, the FPI went down from 93 to 85. To fully understand food market prices, we must look at global views. The EU APIs are key here. They consider regional production and market changes using the Laspeyres formula.
| Price Indicator | Time Frame | Value | Change |
|---|---|---|---|
| Farm Price Index (FPI) | March 2020 to April 2020 | 93 to 85 | -8% |
| Prices Received by Farmers | 2010 to Mid-2014 | 78 to 115 | 47% |
| FPI | November 2020 | 92 | -8% from 2011 |
This close tie between farm and retail prices is complex but important. It shapes what we pay and keeps the market steady. Knowing this helps everyone in the food chain make better choices.
Setting strong economic benchmarks in agriculture is key. It helps measure how well products are doing financially and if they’ll last. The USDA’s ERS Food Price Outlook gives detailed forecasts on how food prices could change over 18 months, offering vital insights.
The USDA, ERS uses the CPI and PPI to estimate annual food price swings. The CPI shows how the prices on a range of goods and services that city dwellers pay change over time. It includes specific food prices too.
The CPI for food helps us track changes in what people pay at the shops. This is important for understanding how it affects consumers and the market.
The USDA, ERS always updates and betters its forecasting methods. They made a new system in January 2023, keeping old data for comparison.
The EU keeps a close watch on agricultural prices through the API. This method uses a standard way to check prices, so we can compare without mixing things up. It ensures benchmarks stay consistent.
| FAO Index | April 2024 | March 2024 |
|---|---|---|
| Food Price Index | 119.1 points | up 0.3% |
| Cereal Price Index | 111.2 points | up 0.3% |
| Vegetable Oil Price Index | 130.9 points | up 0.3% |
| Dairy Price Index | 123.7 points | down 0.3% |
| Meat Price Index | 116.3 points | up 1.6% |
| Sugar Price Index | 127.5 points | down 4.4% |
The info from USDA and EU APIs is gold for everyone involved. It helps them tackle the twists and turns of the market wisely. So, knowing and using these agricultural pricing standards is great for keeping competition fair and planning for the future.
To understand agricultural market rates, we look at lots of data and the industry itself. The National Agricultural Statistics Service (NASS) runs surveys on about 100 crop and livestock items in many states. These surveys fit what each region mostly produces.
About 2,000 places like mills and buyers are asked about grains and other crops each month. This gives us important figures on what’s being sold and how much money is made. The Agricultural Marketing Service (AMS) also gets prices from packing plants and livestock auctions regularly. This all helps get accurate farming price information.
NASS uses monthly estimates for what 48 products sell for. This helps create price indexes for all farm products, individual crops, or animals, and more. These indexes are key for figuring the value of what farms make. Many agencies, like the USDA, use this data for big national economic calculations.
Looking at these rates, we see many things can change what stuff sells for. For example, prices dropped a lot during the 2007–2008 crisis and because of COVID-19. The Farm Price Index (FPI) shows these changes well.
The data on what farms make helps the USDA with its jobs. The Risk Management Agency (RMA) uses it for insurance, and the Farm Service Agency (FSA) uses it for payments in tough times. This data is also important for the Federal Reserve and ERS to watch how prices change.
Every month, the USDA’s NASS puts out the FPI, which is really important for the economy. It joins other indexes like the Producer Price Index (PPI) and Consumer Price Index (CPI). These all show how prices are moving, from the farm to what shoppers pay.
The FPI has data going back to 1910. This helps us look at long-term trends in farm prices. For example, its value was 92 in November 2020, meaning prices were 8% lower than in 2011. This helps everyone in the market plan for the future, knowing if prices are going up or down.
| Key Agency | Role | Data Utilisation |
|---|---|---|
| NASS | Surveys 100 commodities | Calculates monthly price estimates |
| AMS | Collects daily, weekly, and monthly price data | Provides detailed market insights |
| ERS | Uses commodity cash receipts for accounts | Contributes to National Income analysis |
| RMA | Uses state-level price data | Supports insurance programmes |
| FSA | Relies on price received estimates | Determines countercyclical payments |
| Federal Reserve System | Utilises price received indexes | Measures commodity price changes |
Farms see prices go up and down a lot due to different reasons. These changes can be hard to predict. It’s important for those who work in farming to understand why prices change. This helps them handle the risks better.
Many things can make farm prices change a lot. Problems in the supply chain, like late deliveries or failed crops, can make prices rise or fall quickly. Traders’ actions, which are hard to predict, can make these changes even more sudden. Besides, climate change makes it hard for farmers to predict how much they can grow. This adds to the problem of inconsistent supplies.
The United States Department of Agriculture’s National Agricultural Statistics Service (NASS) helps track these price changes. They survey about 2,000 places every month. This includes mills, elevators, and buyers. They also look at 100 different crops and types of livestock. NASS then uses this information to create indexes that show if prices are going up or down over time.
Big events, such as the 2007–2008 financial crisis and the COVID-19 pandemic, show how much prices can change. For example, because of the COVID-19 pandemic, farm prices dropped a lot in April 2020. This was because of bad weather. But by November 2020, prices had started to go back up.
There are ways for farmers to protect themselves from these ups and downs in price. Having more than one type of crop is one way. This makes the risk lower because not all their eggs are in one basket. There are also financial tools like futures contracts and crop insurance. These can help farmers keep their prices stable or get compensated if things go wrong. Doing good market research helps too.
Data from NASS helps everyone involved in farming understand what’s happening in the market. The info includes what prices farmers get for their crops and livestock. It also tells us about the costs of animal feed. Having all this data helps businesses and the government make better decisions. They use it to help farmers and to make sure we have food on our tables.
Using these tools can help the farming industry not just survive but thrive, even when the economy is unstable.
It’s vital to know about crop value metrics. They help us see how well farming is doing and make sure it’s profitable. By measuring the value of farm products, these metrics let us make smart guesses about the future of farming.
Value metrics play a key role in farming. They help us understand how prices are changing. The Farm Price Index (FPI) is a big deal. It’s issued every month by the USDA. It looks at the prices of crops and animals. The FPI gives us a close look at farming’s economic health, like other important indexes do for other industries.
| Year | FPI Value | Implication |
|---|---|---|
| 2010 | 78 | Indicated lower agricultural prices |
| 2014 | 115 | Showed an increase in prices received by farmers |
| 2020 (March) | 93 | Pandemic-induced price drop |
| 2020 (April) | 85 | Continued decline due to adverse conditions |
| 2020 (November) | 92 | Rebounded post-initial pandemic shock |
Looking at these metrics helps us understand farming. Things like weather, the economy, and how people buy stuff can change farm prices a lot. The years of the 2007–2008 financial trouble and the COVID-19 pandemic show how wild farm prices can get.
Comparing these metrics to indexes like the Consumer Price Index shows us bigger economic movements. Historical FPI data, from 1910 to 1960, can help us see long-term trends in farm prices.
Using crop value metrics is not only good for understanding the market but also for making investment choices. Farming companies change how much they produce by looking at these metrics. They can help spot if prices are going up or down.
An in-depth rural pricing statistics analysis looked at March 2024. The all-items Consumer Price Index (CPI) for food went up by 0.1%. This shows a 2.2% increase in food prices from March 2023. Food prices to eat at home went up by 1.2%. But, the cost of eating out, shown by the food-away-from-home CPI, jumped by 4.2%. This difference shows how grocery and restaurant prices are changing in different ways.
Looking to 2024, prices for food are expected to increase by 2.2%. Food you buy to eat at home should go up by 1.2%. Cost of eating out is set to rise by 4.2%. This trend is similar to what we have seen from 2009 to 2019. It shows that prices for food to eat at home and away from home grow differently. This points to how consumers act and respond to the market changes.
From 2009 to 2019, food-at-home and food-away-from-home prices showed different growth. It reflects how consumers act and economic impacts.
Looking at past and current data gives us important insights. For example, in 2020, it cost more to buy food for home than to eat out. In 2022, all food prices rose by 9.9%, with food to eat at home going up by 11.4%. Eating out prices increased by 7.7%.
In 2023, prices went up again by 5.8% overall. But, food at home prices rose by 5.0%. Out prices rose by 7.1%. This continued into March 2024 with egg prices going up by 0.2%. Eggs are expected to be 4.8% more expensive for the year. On the other hand, dairy product prices went down by 0.4%. They are expected to fall by 1.6% across the year.
The Producer Price Index (PPI) is key in predicting future CPI trends. It is vital for understanding the supply chain. The PPI looks at unprocessed food, processed foods, and foods ready for consumers. This helps with a detailed look at rural price metrics. The Agricultural Price Index (API), from January 1988 to February 2024, uses base years 2000 = 100 and 2020 = 100. It measures price changes in comparison to chosen years. The API covers prices farmers get for their products and the costs they have, giving a full market overview.
The following table summarises monthly data for March 2024:
| Category | March 2024 Increase (%) | 2024 Forecast Increase (%) |
|---|---|---|
| All-items CPI (food) | 0.1 | 2.2 |
| Food-at-home CPI | 1.2 | 1.2 |
| Food-away-from-home CPI | 4.2 | 4.2 |
| Retail Egg Prices | 0.2 | 4.8 |
| Dairy Products Prices | -0.4 | -1.6 |
This rural pricing statistics analysis gives key insights into rural areas. It looks at prices, trends, and incomes deeply. It helps those in agriculture understand and make decisions in the market.
In the world of agricultural economics, aggregate agricultural price indexes are key. They help shape policies and steer investment plans. These indexes give everyone an overview of price movements. This highlights market conditions and the health of the economy.
The role of aggregate price indexes in policy-making is critical. They bring together price information from different crops or produce. This helps officials make smart choices about how to oversee the market and where to give support.
The EU uses the Laspeyres formula to work out its Agricultural Price Index. It looks at each country’s prices, using fixed weights from the starting year. This method captures a broad view of how the sector is doing. It makes creating good policies easier.
Aggregate agricultural price indexes also deeply affect how farmers and others invest. People use these indexes to understand market trends. This helps in spotting chances for growth. For example, the way product groups and the index as a whole are calculated give a solid measure for deciding if an investment is good.
The FAO Food Price Index is another important tool. It looks at global prices for certain crops and goods. This index is key for those making investment choices. It provides a worldwide view that’s essential for smart investments.
Understanding these indexes is crucial for policy and investment. They are vital tools for dealing with the challenges of the agricultural market. They ensure decisions are well-thought-out and strategic.
It’s vital to understand how local farming economies connect with the global market. Bodies like the NASS and the FAO help with this. The NASS looks into around 100 farm products through surveys, helping to compare global markets.
The NASS, along with other groups, make it possible to compare prices worldwide. They compare prices for all farm products and livestock. The FAO’s FFPI is a key tool, showing up-to-date prices for a variety of farm goods. It lets countries see how well they’re doing compared to the world.
Agricultural price indexes not only show farm health but also economy-wide wellness. The ERS and BEA use these to measure the country’s income. Also, the Federal Reserve looks at these indexes to track price changes. State governments use this data for property value and taxes.
By connecting farming prices to global markets, we gain useful insights. These help with policy-making and understanding the world’s markets. Agricultural indexes are crucial for global trade.
Agricultural price indexes show changes in farm produce trends and market shifts. They help everyone in the industry understand the economy better. This knowledge is key for making smart decisions.
About agricultural price indexes, they check the health and performance of farming. By looking at various farm goods, they give insights into price changes. This info is crucial for planning ahead wisely.
Over time, agricultural price indexes have changed with the farming world. They include demand, tech changes, and rules. This helps us know where the industry was and where it’s going.
Farm-to-retail price transmission tracks how prices change from farms to shops. It looks at costs for making, moving, and selling goods. This shows how prices move before reaching you.
In farming, prices moving from farm to shop are complex. Often, shop prices change faster when goods cost more. This is compared to when goods are cheaper.
Agricultural price indexes include food like crops, animals, and milk. They are chosen to show the market’s real situation correctly. This way, we get an accurate picture of what’s happening.
Weighting is very important for these indexes. It decides which goods matter most. This makes sure the index tells a true story about the market.
Many things affect farming prices. This includes how much is wanted, the weather, and government rules. Together, they set the prices in the farming world.
Supplies and wants greatly change prices in farming. If either side changes, goods can become more or less expensive. This is basic economics at work.
Weather’s role is big because it directly affects what can be grown. Bad weather may lead to fewer goods, making prices rise. Good weather often means more goods and lower prices.
Government rules and help are aimed at keeping farming stable. They can change prices by affecting how much it costs to make and sell goods. This affects how much is available and its cost.
The S&P GSCI and Bloomberg Indices are important. They look at the market in different ways. This gives a rich view of the agricultural world.
Indices use different ways to weight goods, either by importance or easily they can be turned into money. How they do this affects what the index says about the market.
These indicators keep watch on farming products. They provide clear signs on where prices and products are going. This helps with money and policy choices.
In spotting future market trends, these indicators are key. They show where the market is headed. This guides actions and choices in money and policy.
Prices have changed a lot, marked by things like demand for biofuels and how much we trade. These changes show how farming reacts over time.
Today, prices are affected by global trading, tech advances, and new rules. These patterns show that farming is always changing.
The link between farm and shop prices is complex. Knowing this helps find out how much of the price you pay goes back to farmers.
These benchmarks set fair prices to check how well goods perform. They make sure everyone in the trade gets a fair deal. This helps know how the market is doing.
Knowing farming’s market rates means looking at what makes prices change. This includes how much people want, money values, and tariffs. It shows how lively the farming market is.
Prices jump around because of disruptions, guesses on prices, and the climate. Figuring out these reasons helps keep prices and incomes steady in farming.
Preventing big price changes includes growing different things, using money tools like futures, and knowing the market deep. These actions help keep farmers and prices stable.
Metric for crops help see how well farming is doing and where it’s going. By putting a value on crops, it helps predict the future and see the worth of each one.
Looking at rural prices details the economy in farming areas. It looks at costs, how well the market does, and incomes. This paints a clear picture of rural money health.
These big price indexes help shape market rules and support plans. They’re key to making good moves in farming. They guide important choices in the field.
For investors, these big price indexes are a goldmine of info on where the market is going. They help make smart choices to get the most out of farming investments.
Big indexes place farming in the global market, setting up benchmarks to compare prices worldwide. They show how healthy the trading and farming world are.
Comparing indexes worldwide gives us a wide view of the market. It helps see how well farming is doing on a global scale. It shows its place in the world economy.