Walking through the English countryside, I was taken aback by the lively scene. It wasn’t just about the beautiful landscapes. It was the skylark’s song, the bees buzzing, and the wind softly rustling plants That moment connected me deeply with nature. Yet, this beauty is at risk with agriculture’s impact on biodiversity. We need thorough assessments to grasp this and safeguard our future.
Many studies now focus on biodiversity in farming, with about 100 new articles each year. This increase shows the growing attention to these measures. Biodiversity indicators help us check the health of farm ecosystems. Plus, they guide us in finding ways to farm that are both productive and eco-friendly.
Biodiversity isn’t just about how many species there are. It’s also about the variety within species, the communities they live in, and the places they call home. Think about the soil, for instance. It houses up to 11,000 different life forms in a single gram. This hidden world helps plants grow and keeps the soil fertile.
In France, common birds act as a sign of how well farming supports wildlife. But these birds are dwindling due to intensive farming. This decline highlights the need for better ways to watch and fix farming’s effects on nature. Measures like the Shannon index help us see if an area’s biodiversity is in good shape by looking at dominant species.
Understanding these indicators gets more crucial when you see how much land farming uses. In Europe, half of the wild animal species find their homes in farmlands. Biodiversity measures are essential to keep these places viable for wildlife. This shows how vital it is to maintain diverse life in agriculture.
Understanding biodiversity indicators means knowing what they are and why they’re key in farming. These measures track the effects of farming on nature to help us farm better, which is good for the planet in the long run.
The term biodiversity indicators definition refers to ways to measure how our farming activities affect nature. These measures look at many things, such as the number of species and how well ecosystems function. They also consider the services ecosystems provide, like clean air and water, food (through pollination), and climate control.
The importance of biodiversity in agriculture is huge. It supports natural processes that are vital for farming, like controlling pests and pollinating crops. Biodiversity also includes various plants and animals we use for food, making it crucial for feeding the world. Besides its economic value, it has cultural and health benefits too.
The story of biodiversity indicators began at the Rio Conference in 1992. They started becoming tools to keep track of the effects of farming in developed countries. At first, they mainly looked at grassland plants. But now, they cover more, including all kinds of farmland and small ecosystem features.
As technology got better, we can use things like digital tools and genetic markers to check biodiversity in much detail. Still, we don’t use these indicators everywhere, even though we could.
| Region | Forest Specialists (1965) | Grassland Specialists (1965) | Aridland Specialists (1965) | Farmland Specialists (1965) |
|---|---|---|---|---|
| U.S. | 96 | 24 | 17 | — |
| Europe | 29 | — | — | 36 |
Biodiversity in agriculture is vital for keeping our world in balance. It includes many different types of life. Each type helps keep the environment healthy and provides valuable benefits.
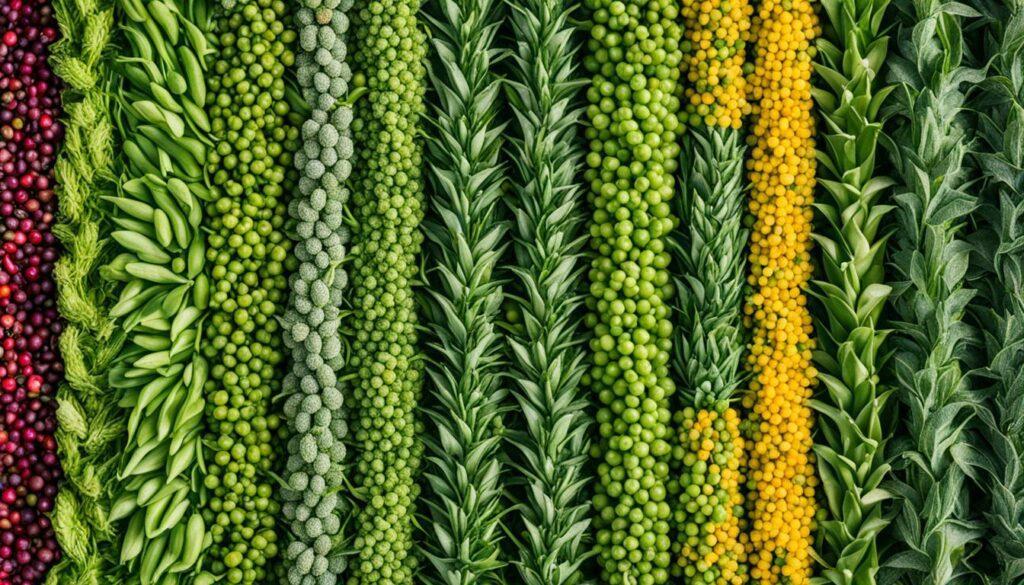
Genetic diversity is all about the variety of genes within a species. This variation is key in making sure plants and animals can deal with changes. It helps them fight off diseases and adjust to new environments.
Species diversity means there are many different kinds of life living together. Studies show that more types of life make areas stronger and more productive. This is because they do important jobs like pollinating, keeping pests in check, and keeping soil healthy.
Community and habitat diversity are about the many habitats and ecosystems in the world. They show how different areas are home to different plants and animals. By having a variety of places to live, species can thrive and better withstand challenges.
To show what biodiversity in agriculture is all about, let’s look at some figures:
| Component | Significance | Current Status |
|---|---|---|
| Genetic Diversity | Facilitates adaptation and disease resistance | Mean agrobiodiversity status score globally is 56.0 |
| Species Diversity | Supports ecosystem functions like pollination | Only 30% of edible plant species assessed, 11% threatened |
| Community and Habitat Diversity | Maintains ecosystem resilience and productivity | Developing countries lag behind in conservation scores by 14-82% |
The numbers from these surveys clearly show how important it is to work together. Through conservation and management, we can keep our food systems strong across the globe.
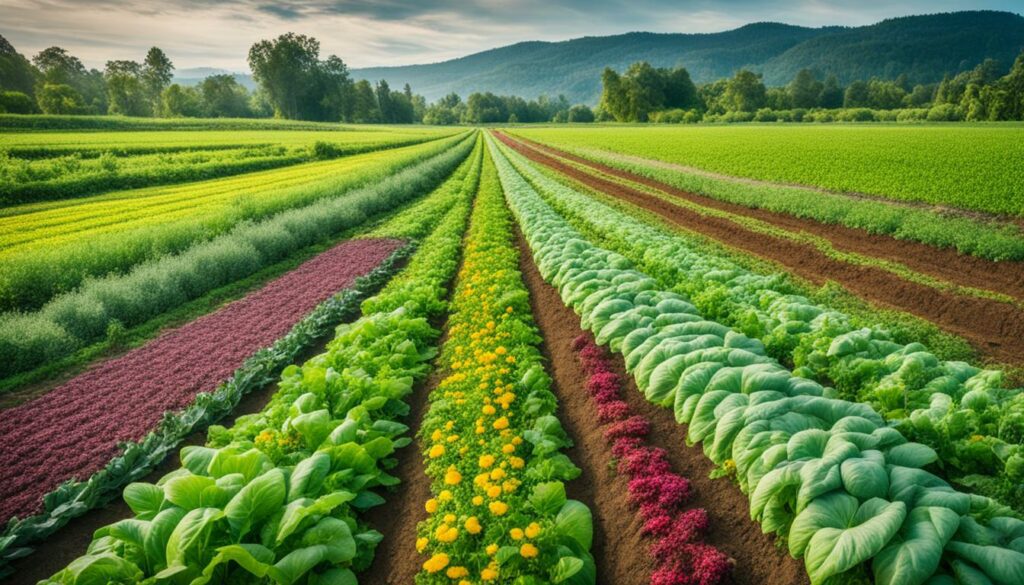
Using ecological farming methods is key to boosting the number of species in farm areas. Making farming areas bigger and using organic methods helps cut down the harm from large-scale farming. Also, looking after semi-wild areas like field edges and ponds is vital for keeping the farm’s natural balance.
Making farms bigger and cutting back on chemical use helps wildlife thrive. A big study found that methods like no-dig, cover crops, and natural fertilizers help. For example, having earthworms around can boost crops by 25% and make plants grow better by 23%. So, looking after earthworms is a good sign that the land is doing well.
Choosing organic farming helps too. By avoiding synthetic chemicals and using natural ones, biodiversity can grow. Using natural fertilisers helps more than not fertilising at all. This kind of farming, without pesticides, has been proved to really help many different animals and plants.
Taking care of wild areas near farms is also crucial. This includes looking after field edges, hedgerows, and ponds. It all helps more creatures to live there. For example, beetles show us how healthy an ecosystem is. Studies tell us these wild areas are great for many species, making the whole ecosystem richer in life.
| Practice Group | Impact on Biodiversity | Key Findings |
|---|---|---|
| No Pesticide Use | Positive | Broadly studied; benefits across multiple taxa. |
| Planned Biodiversity Interferences | Positive | Enhances richness and diversity metrics. |
| Organic Fertilizers | Positive | Better than no fertiliser in enhancing biodiversity. |
Tools for managing farms are getting more advanced. Many farmers use technology for keeping track of chemicals and fertilisers. But not many use it for watching water use and energy. This shows we need to do more to use technology to help wildlife on farms.
It’s key to grasp various types of biodiversity indicators for complete environmental biodiversity checks. We group these into direct and indirect biodiversity indicators, predictive ecological indicators, and measured biodiversity metrics. Each group brings something different to understanding ecosystem health and long-term care.
Direct biodiversity indicators involve hands-on measurements in nature. They provide solid data on things like the number of species, how much carbon forests hold, and how stable the soil is. These are vital for checking how farming and tree crops affect biodiversity.
On the other hand, indirect indicators use simpler details or comparisons to gauge health. For instance, looking at CO2 levels in and out of forests shows how well they’re sequestering carbon. It provides clues about the health of the forest indirectly.
Predictive ecological indicators use computer models to guess at environmental effects. They’re great for giving early warnings and for spotting trends in genetic plant diversity. These kind of indicators help plan ahead to prevent problems like deforestation, supporting future biodiversity.
After environmental checks are done, we get measured biodiversity metrics. They include things from ongoing soil health checks to how well water is managed. These measures help in assessing how practices, especially in farming, influence the environment.
For farming, measured indicators could be the types of species present, the variety in soil microbes, and how many birds live there. These detailed checks are important for understanding the impact of farming on biodiversity, guiding better practices.
Agri-environmental schemes use many indicators to follow biodiversity changes in nature. Early schemes looked mostly at plant species in grasslands. Now, we use a wide range of indicators. Technology such as simulations and genetic markers helps track biodiversity better.
Looking at different species helps us see how healthy an area is. For example, studying plants mainly uses vascular plants in grasslands. Earthworms are key too. They can boost crop yield by 25% and the aboveground growth by 23%.
This shows how valuable it is to check various species for agriculture.
New molecular methods have changed how we look at soil microbes. This deeper look shows us what’s needed to keep soil healthy. The Open Soil Index from the Netherlands helps standardize soil evaluations. This makes it easier for farmers to keep their soil in good shape.
The drop in bird numbers on farms shows how biodiversity is changing. In North America, bird numbers fell by 74% from 1966 to 2013. This drop is a big sign of how healthy ecosystems are. It also affects things like keeping pests under control.
Countries like France are seeing fewer birds that live on farms. This tells us we need better plans to protect biodiversity.
“Bird populations have significantly declined, with far-reaching implications for ecosystem stability and agricultural productivity.”
To sum up, using species, soil microbes, and birds as measures helps us watch and better nature in farming areas. These indicators can help leaders and farmers make plans to save biodiversity.
Measuring biodiversity in farming is key to know how healthy and sustainable it is. We use a bunch of different signs to do this. Some are common, like checking how many different species live in an area. Others are super specific, looking at what’s happening on each farm.
One way we figure out how diverse an area is by looking at the plants. This is especially true for grasslands. Many studies rely on these plants to understand how biodiversity is doing in farm areas. However, for places beyond just grasslands, info is not so easy to find. This is why, starting in 2023, the EU is working on new plans to help biodiversity on farms.
In Switzerland, there are lots of plans that give farmers money for helping biodiversity in grasslands and vineyards. These payment plans are getting more popular. In Ireland, they’re working on ways to measure biodiversity depending on how the grasslands are looked after.
Looking at plants is good for big pictures, but for detailed looks, we need farm-specific measurements. These can show how farming choices, like using fertilisers, affect the local wildlife. New tech like simulations, digital tools, and genetic markers are making it easier to get these details.
Future advancements in technology are expected to significantly enhance the design and compilation of biodiversity indicators for agriculture, making them more accessible and reliable.
There are apps you can use to identify plant species but not many are used for farming yet. This shows there’s a lot of room for new tech to help farmers’ sustainability by making tools that are easy to use and very accurate.
Looking at biodiversity in this way not only tells us about the health of the land but also helps farmers choose greener, more sustainable ways to work. By using both simple and detailed ways of looking, we can tell how farming affects nature as a whole and in specific, positive ways.
| Indicator Category | Example | Application |
|---|---|---|
| Common Agricultural Indicators | Species Diversity | General monitoring of biodiversity status in grasslands |
| Farm-Specific Metrics | Impact of Fertiliser Use | Assessing individual farm practices and their effect on local biodiversity |
| Advanced Technological Tools | Genetic Markers | Facilitating precise measurement and monitoring of biodiversity on farms |
| Technological Adoption | Smartphone Apps | Potential future widespread use for real-time biodiversity assessment |
Sustainable agriculture metrics are key in showing how farming and protecting wildlife connect. They help check things like how many species there are, how varied the land is, and the gene pool health. Knowing this stuff helps make sure the ecosystem can cope with issues and meet future aims.
The Biodiversity metric relies on the Habitat Potential Index (HPI) after being created in 2014. It is vital for knowing if farm areas can help many different species thrive. This new way highlights the importance of saving wildlife by setting a proper check for how healthy the habitats are.
Energy use on farms has changed loads since 2009. By 2017, it got more detailed with seven new parts. Now, this counting way helps farmers cut down on the energy they use. This makes their farms more eco-friendly and efficient.
Greenhouse Gas Emissions have been under careful watch since 2009. They updated the info in 2016 and 2017 to look at more types of gas. Recognising climate change, these new checks are about making farms more earth-friendly.
The Irrigation Water Use metric has been around since 2009. It finds ways to use water better for growing crops. This saves water and helps the land and its life stay strong.
The Land Use metric sizes up how well land is used since 2009. It makes sure we grow more without hurting places where life flourishes. This way, farming can grow without risking wildlife.
Looking after the soil comes under the Soil Carbon metric. It uses SCI and COMET-Planner tools, starting in 2021. Checking the soil’s carbon is crucial for keeping farms in good shape for the future.
The Soil Conservation metric started in 2010 to fight soil loss. It uses the IET and has seen updates in 2012 and 2018. This way, soil can stay fertile and farms can go on working well.
Managing nutrients is at the heart of good farming. The Water Quality metric joins in by tackling nutrient run-off, starting in 2021. This tools help keep wildlife safe and water clean.
Cutbacks in soil loss and gas leaks are shining lights of farm progress since 1980. At the same time, farms got better at using energy, water, and land. But, since 15 years ago, these improvements are slower. This points out we still need strong tools to keep getting better at farming.
All in all, using these detailed metrics can help farming do better for wildlife and the land. Updating and refining these checks means better, kinder ways of farming. This is good for nature and for us.
It’s key to see how ecosystem services and biodiversity are linked for better farming. Pollination, pest control, and keeping nutrients flowing are examples of this link. They help make farms more productive and able to bounce back from challenges.
Pollination’s role in crop growth and quality is huge. Bees and other pollinators are central to making many foods we love. Areas with lots of different plants and trees help keep these essential helpers around.
Natural pest control is also a big deal. Having many species in farming areas means fewer harmful bugs. This means less need for harmful chemicals that hurt the Earth.
Having a variety of life in the soil is vital for its health. It boosts the use of plant food and helps crops grow better. Think of forests as a great example of how to do this well.
Forests and plants are key for stopping soil erosion. This keeps the ground stable and farmable for a long time. It shows how important nature is for lasting success in farming.
Estimating agroecosystem health is vital for sustainable farming. There are 570 million farm owners globally working towards ecological practices. To help this shift, we’re creating detailed frameworks and key indicators.
The CGIAR Agroecology Initiative leads in creating a complete evaluation system. It includes over 100 possible indicators. These are key for checking the health of ecosystems and their effects on farming. Their aim is to cut this list down to 69 indicators, organised into 16 sections, for a thorough evaluation.
| Feature | Description |
|---|---|
| Number of Indicators | 100 potential indicators, refined to 69 feasible ones |
| Assessment Themes | 16 themes encompassing various aspects of agroecosystem health measures |
| Tool for Agroecology Performance Evaluation (TAPE) | Provides multi-scale sustainability evidence; adapts to local sustainability objectives |
| Participatory Process | Stakeholders in the Agroecology Living Landscapes will identify local key indicators |
Worker involvement is key in selecting what’s critical for their areas. It makes sure the assessments are useful and fit the local region. This approach tailors how we look at the environment, social, and economic factors of each farm.
We’ll set global KPIs to measure the impact of eco-friendly farming on money, the planet, and people’s lives. These KPIs will work in any food system, covering broad ecological health areas. The holistic method aims for credible, doable, and scientific measurements needed for useful assessments.
A successful strategy focuses on what’s happening at the grassroots level. This design helps gather relevant data on how biodiversity affects the land. Tools such as the Healthy Farm Index bring together many measures. They fit farm needs, helping farmers keep their lands healthy and productive.
Biodiversity monitoring is key to checking on agricultural areas’ health. We use both old methods, like field work, and new tech, such as remote sensing and GIS. These tools help us see the habits of plants and animals. They also show us how to protect these areas from harm, helping biodiversity in the Americas.
Going out into the field to check on nature is crucial. We look at how many different species there are, how varied the habitats are, and how populations are changing. In North America, bird numbers on farms dropped by 74% from 1966 to 2013. Such losses highlight the need for on-the-ground checks. Using the Habitat Potential Index (HPI), we can find out if farms have good habitats. If their scores are low, there’s a big chance to make things better. Tools like the Biodiversity & Soil Health Metrics Tool guide experts in watching over nature. They help put good plans together for making nature thrive.
Looking at ecosystems from far above and mapping them have brought big changes. Remote sensing and GIS offer a clear view of big areas. They help us protect spots that are at risk from things like the edge of development or being preyed on. With 75% of farm crops needing pollinators, the $351 billion pollination is hugely important. These methods let us keep an eye on changes and respond quickly to help biodiversity flourish.
| Tool/Method | Purpose | Cost | Scope |
|---|---|---|---|
| Field Measurements | Assess species richness and population trends | Medium | Local to Regional |
| Remote Sensing | Analyse spatial patterns and habitat fragmentation | High | Regional to Global |
| GIS Technologies | Map and monitor biodiversity indicators | High | Regional to Global |
| Biodiversity & Soil Health Metrics Tool | Design effective ecological monitoring for NbS | Variable | Project-based |
Understanding challenges in biodiversity assessment needs us to know a lot about nature. We have to be careful with how we handle data. It all starts with seeing just how complex measuring nature is. We need to consider everything from the edges of fields to tiny soil life.
Looking at biodiversity in farms is tough because of the complexity of ecological measurements. Groups like the Hutton’s Centre have used many measures since 2009. They look at things like soil health and how the land is physically. But, we also have to think about big goals like feeding everyone without hurting the planet more. Balancing these is really complex.
Getting enough data and making sure it’s good is another big problem. Knowing what the environment was like before helps us set new goals. But, using different methods for these studies makes it hard to compare. To keep an eye on changes, we’re looking at new signs, like the edges of fields and the soil life.
Below is a table showing important indicators and methods for assessing biodiversity:
| Indicator | Measurement Focus | Example |
|---|---|---|
| Field Margin Vegetation | Margin structure and composition | Assessing habitat richness and resource value |
| Soil Quality | Microbial diversity, carbon content | Baseline data for monitoring sustainability |
| Species Abundance | Population metrics | Bird population indicators in farmland |
| Life Cycle Assessment (LCA) | Comprehensive supply chain impacts | Modelling potential environmental impacts |
Handling biodiversity assessment challenges is really important for the future. The land is changing, and we might lose some wildlife because of this. Good tracking and action plans are needed to keep nature safe.
In agriculture, it’s clear that we need new ways to check on biodiversity. We face a big challenge, with 40,000 species at risk in the next few decades. This shows we need to get serious about finding ecological solutions and updating our farming methods. New technology and strong policies can help us protect species better.
Digital advancements and new environmental schemes bring hope for nature. They make it easier to look after and keep track of species. And we really need to, as we’ve lost a lot of forests recently. We must use high-tech tools to watch nature in real time and predict problems.
Moving forward means we need solid rules and support from groups. Many countries and the EU agreed to the Nagoya Protocol by February 2022. This means more support worldwide to save species. The area of forests under protection grew by 35% from 2010 to 2021, showing we’re heading in a better direction.
By 2021, we were doing better at protecting places important for wildlife. And 37% of countries were making good progress on their nature-saving goals by 2022. This proves that good policy and support can really help. But we must do more to stop the damage farming causes to our forests.
Biodiversity indicators in agriculture show how farming affects plants and animals. They look at how many types of species there are. And they check on how healthy the farm environment is.
They’re important because they tell us how well farms are doing. Are they helping or hurting nature? These tools push for ways to farm that keep nature safe.
After the 1992 Rio Conference, people paid more attention to these indicators. Now we use many ways to figure out if nature is okay because of farming.
In farming, we need different kinds of life. This includes different types of the same species, many species together, and their habitats. All this keeps the farm healthy.
Ecological farms avoid hurting nature. They keep wild areas for animals and plants to live. This makes sure a lot of kinds of species can thrive.
We can measure biodiversity directly in the environment. Or we can use formulas to guess how farming might harm or help nature. Both ways tell us if farming is doing okay for nature.
We often look at how many different plants, animals, and tiny living things are in a farm. This tells us if the farm is safe for nature.
These metrics show if farming is keeping nature safe. They measure how well nature survives because of farming. It’s about making sure the land and its life stay healthy.
Plants and animals help farms in many ways, like helping crops grow without bad bugs. They also stop soil from being washed away. This shows how farming and nature need each other to work well.
We use ground checks, surveys, and tech like GIS to see how well nature is doing on farms. These tools help us know what’s happening in the environment.
It’s hard to pick the right checks, handle lots of data, and keep it all correct. Different ways of measuring and finding data also make it tough to fully check farms’ effects on nature.
Soon, we might use more tech and new farming strategies to care for nature better. But this needs help from laws and groups that focus on nature. They can make sure we’re working towards keeping nature safe.