Trading commodities started many years before stocks and bonds. Knowing the history and understanding market trends is key to success in commodity trading. The long history of trading shows how crucial price charts are. These charts help traders analyse markets and develop trading strategies.
Price charts for commodities are like a map for traders. They show past and current prices. This helps predict future trends. Anyone interested in trading should learn how to read these charts. They are essential for making smart trading decisions. This guide will explain how to use commodity price charts effectively for better trading.
Commodity price charts are key for traders. They show the movement of prices over time. With these charts, traders can look at past and current prices. This helps them make better decisions in the market. Knowing how to read these charts is crucial for trading well.
Commodity charts are vital analytical tools. They help both traders and investors understand market trends. By looking at historical and current prices, they get a full picture. This allows for detailed analysis and better predictions of future prices.
These tools are very helpful for various types of commodities. This includes items like food, metals, and softer goods such as sugar and coffee.
The use of commodity charts goes way back to early trade. Commodities are at the heart of many economies. The way we trade them has changed a lot since the 1800s when futures exchanges started. At first, traders charted by hand. Now, we have advanced digital tools for market analysis.
For instance, the Chicago Board of Trade started in 1848. This was a big step in organising these markets. The Grain Future Act of 1922 was another significant change. It showed that these markets needed proper rules and oversight.
Today, digital tools for charting have made a huge difference in trading. They offer up-to-the-minute information and deep analysis. This gives traders a better view of what’s happening in the market. Thanks to these charts, trading has become a lot more precise and strategic.
Looking at commodity market trends helps us make smart trading choices. By using historical prices and current data, we can guess future movements. This lets traders and investors change their plans wisely.
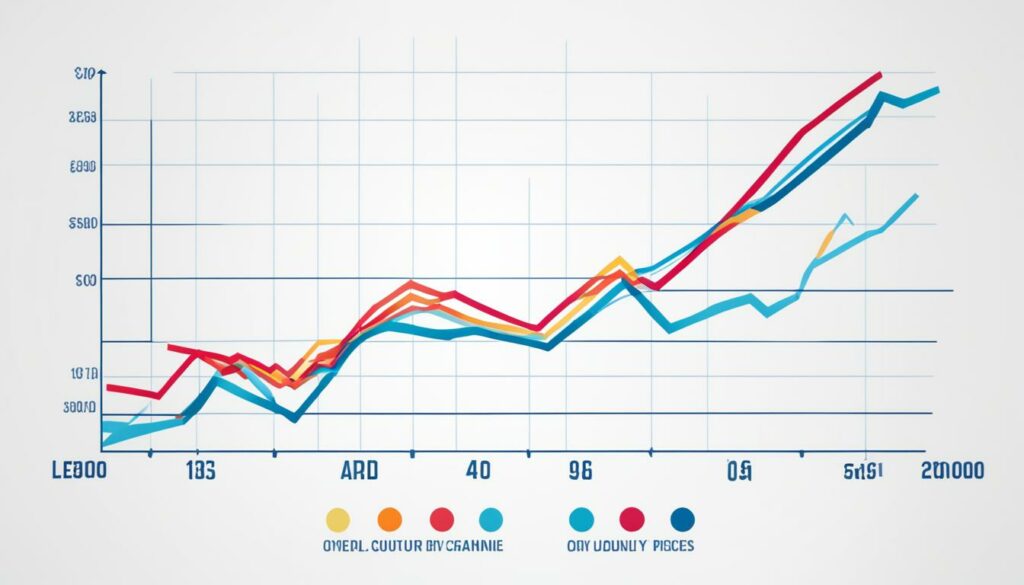
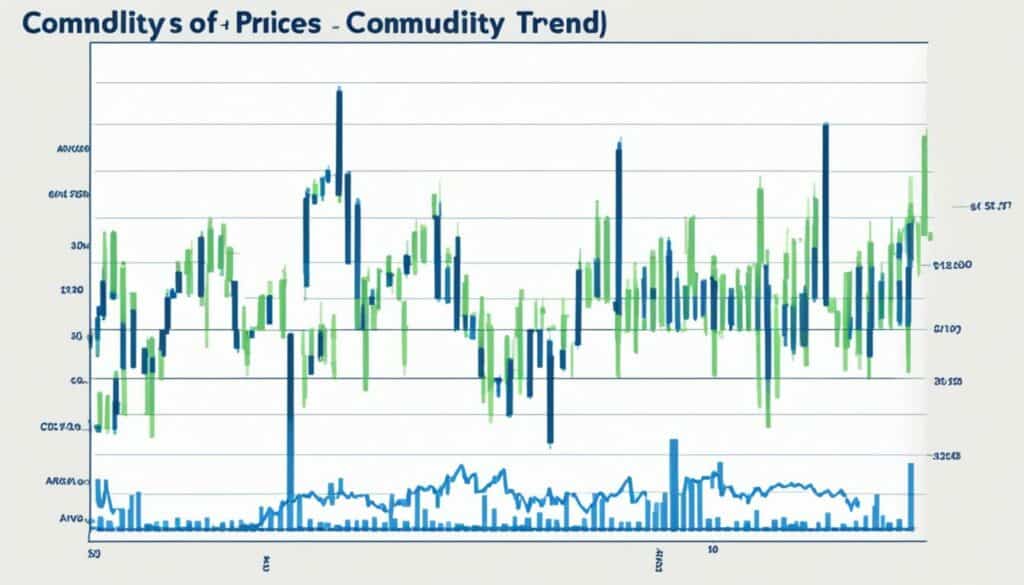
Traders use price charts to spot market trends. These charts show past prices visually. They use moving averages to see a clear trend over short to long periods.
Trend lines are also key. Traders draw lines between highs or lows to see which way prices are headed. If prices cross these lines, it might mean a trend change. This signals new opportunities or risks ahead.
Lots of factors affect commodity markets. This includes global events and supply and demand. Things like political problems or strikes can shake up prices. Natural events like droughts can also change things.
Generally, commodities move differently to stocks and bonds. This makes them good for balancing a portfolio. They can lower overall risk and improve returns over time.
Time of the year matters, too. Crops and energy products can change in price during planting or cold seasons. Analysts use technical tools to spot trends, like channels or cycles. These can show when to buy, sell or hold.
In the long term, commodities react more to supply and demand than to stock market trends. After the 2008 crisis, their link with stocks briefly increased. But it went back to normal once things settled down.
Knowing commodity trends through data and tools is key for traders. It helps manage risks and find new chances in the market.
It’s important to know the different types of commodity charts. They help us understand how prices move. Each one shows us something special about the market trends. This helps us make better decisions when trading.
Bar charts are common in trading commodities. They show the open, high, low, and close prices for a day. This makes tracking the market’s daily moves easy. They are really good for spotting when the market is changing a lot or might not continue on its current path.
Line charts are the most basic type. They connect daily closing prices over time with a straight line. This makes it easy to see the price’s overall movement. They help a lot in finding trends that last a long time. People also use them to compare how different commodities do over time.
Candlestick charts show a lot of detail about price movements. They have lines showing open and close prices and wicks for the high and low points. This kind of chart is great for seeing market patterns and guessing what might happen next.
Learning about different charts is key for a varied portfolio. Commodities‘ prices often move differently than stocks and bonds. This can help lower the risks in your investments. Whether you use bar, line, or candlestick charts, knowing how to read them gives you an edge in making smart trading choices. Commodities’ markets always change, but good analysis can help you navigate these changes well.
| Chart Type | Key Features | Best Used For |
|---|---|---|
| Bar Charts | Open, High, Low, Close Prices | Volatility Identification, Reversals |
| Line Charts | Closing Prices Over Time | Long-term Trend Analysis |
| Candlestick Charts | Open, Close, High, Low Prices with Body and Wicks | Pattern Recognition, Future Predictions |
Knowing past prices really helps in making smart trades. By looking at how prices changed before, traders get a hint on what might happen next. They can spot important price levels. This helps in finding possible market patterns to plan better.
Many places give you detailed charts and price history for commodities. Big names like the World Bank, Reuters, and Bloomberg are key. They have lots of data on different commodities. This includes things like food, energy, and metals.
Analysing past prices means studying long and short-term trends. For example, the Agricultural Raw Materials Index went up by 1.88% in a year. The Beverages Price Index rose by 35.61%. Cocoa beans got a big 109.81% jump, and Olive Oil rose by 70.75% in a year.
This data helps spot big price moves and understand the markets. For example, Australian coal prices fell by 40.13% in a year. Meanwhile, uranium prices almost doubled by 96.85% this year. Looking at these changes helps see where prices might stay steady or change a lot. This knowledge supports making better trade plans.
| Commodity | 12-Month Change | Current Month Change |
|---|---|---|
| Agricultural Raw Materials Index | 1.88% | – |
| Beverages Price Index | 35.61% | – |
| Energy Index | – | 1.07% |
| Crude Oil (Petroleum) | – | 4.56% |
| Coal (Australian Thermal) | -40.13% | – |
| Cocoa Beans | 109.81% | – |
| Oranges | 50.00% | – |
| Pork (Swine) | – | 11.13% |
| Sugar | 11.11% | – |
| Olive Oil | 70.75% | – |
| Uranium | 96.85% | – |
Conclusively, using detailed market tools with historical data can boost traders’ analysis skills. By looking deeply into past charts, traders can build stronger strategies.
Keeping up with live price updates is vital for effective trading. Accurate, up-to-date info is a game-changer. It lets traders respond to market changes quickly.
Various online platforms provide live price updates for commodities. This info is key for staying ahead. Bloomberg, Reuters, and MarketWatch are trusted sources. They offer real-time data and detailed analysis.
With these platforms, traders get a close look at market trends and changes. This insight helps with trading moves.
| Commodity | Current Price | Daily Change | Percentage Change |
|---|---|---|---|
| WTI Crude | $79.23 | +1.07 | +1.37% |
| Brent Crude | $83.39 | +0.12 | +0.14% |
| Murban Crude | $84.22 | +0.17 | +0.20% |
| Natural Gas | $2.507 | +0.012 | +0.48% |
| Gasoline | $2.553 | +0.015 | +0.58% |
| Bonny Light | $83.00 | +0.29 | +0.35% |
Trading apps are becoming a must for live updates. Apps like Investing.com, Bloomberg Mobile, and TradingView provide real-time data. They also give alerts and analysis.
These apps let traders act fast on the latest market changes. They’re crucial for staying on top of trading.
By using online platforms and mobile apps together, traders stay in the know. They can make informed decisions. For example, they’re aware of recent Crude Oil price jumps. This knowledge boosts confidence in the market.
In the world of commodity trading, having the right tools is crucial. The tools you use can make or break your success. It doesn’t matter if you use high-tech software or prefer to do things by hand. What’s important is having the means to analyse trades effectively and build smart strategies.
Trading software has come a long way in the last 15 years. It has changed how we access market charts and analysis. Companies like Trading Central now provide tools to understand price movements and spot chart patterns. Platforms such as Ally Invest, Charles Schwab, and E*TRADE make these tools easy to use.
Take Interactive Brokers, for example. They have a platform called Trader Workstation with tons of indicators and real-time data. Lightspeed has Lightspeed Trader for fast market scans. TradeStation offers TradeStation 10 for precise charting using tick data. And then there are tools like eSignal, iVest+’s Market Gear, MetaStock, and NinjaTrader for even deeper analysis and custom indicators.
Manual charting methods are still relevant, even with all the advanced software available. Techniques like drawing channel lines can reveal important information about market movement and psychology. This is valuable for farmers and investors alike.
It’s also crucial to understand buy and sell signals in manual charting. A sell signal appears if the price drops below the channel line. A buy signal shows if the price closes above the channel line for the second time.
Looking at key patterns and gaps is another manual approach. Bearish key reversals warn of price drops, and bullish key reversals hint at price rises. Patterns like double tops and bottoms can show where the market is going. The head and shoulders pattern, for example, can indicate a change in trend.
In the end, the goal of both advanced software and manual techniques is the same. They aim to improve our understanding of the market and help us make better trading decisions. As technology and methods advance, skilled traders learn to combine new tools with proven techniques.
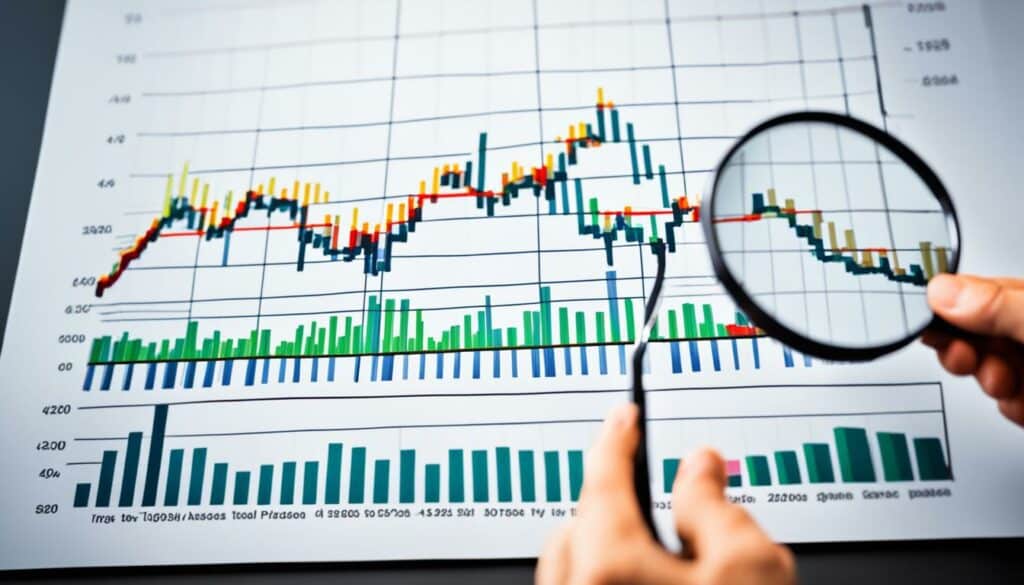
It’s vital to understand how commodity price movements are analysed for smart trading choices. Many things can make prices change a lot. Using tools to analyse and spot trading signals helps traders make smart moves.
Understanding price changes is key to predicting what the market might do. Averages smooth out price data to show trends clearly. You can use different days’ worth of data to make these averages. For instance, 3, 10, or even 100 days.
Each has its line; the nine-day, 20-day, and 40-day lines are especially common. Traders compare these to see short and long-term trends.
Key signals like breakaways and moving averages are vital for trading well. Trend lines connect high and low prices to show the trend. Channels are between two trend lines, showing cycles in prices. These cycles are due to supply and demand changes.
Resistance and support planes are important price levels for each commodity. Tools like the MACD indicator and RSI help find good times to buy or sell. The MACD uses moving averages to find signals. RSI shows if the market is overbought or oversold. Bollinger Bands® shows potential price ranges by fluctuating in width.
These tools, used together, help traders build strong strategies. This leads to smarter and more profitable trades.
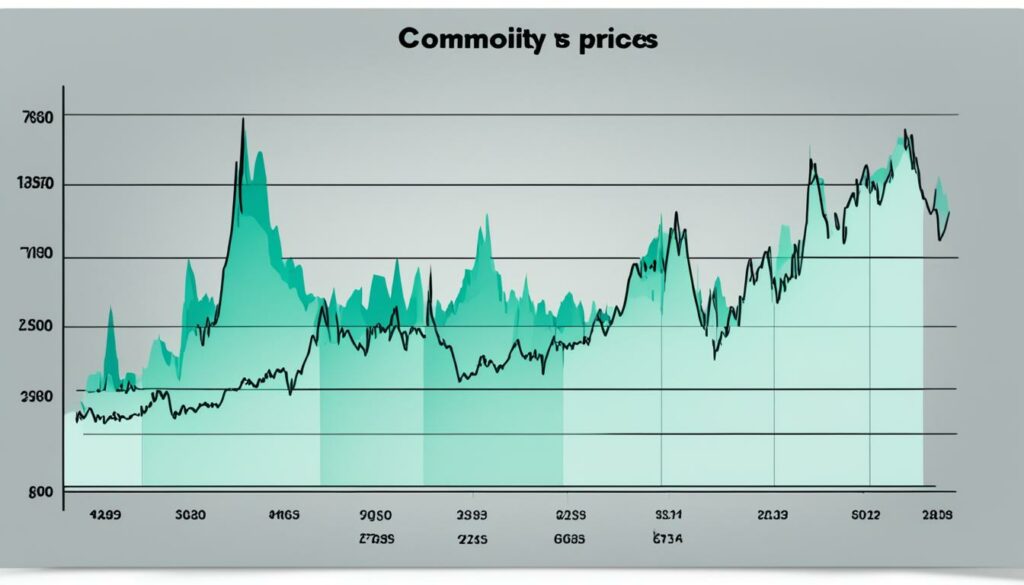
Commodity price charts are vital for traders. They let traders look closely at market trends. This helps them make smart decisions. These charts show prices at different times, like weekly or yearly.
Commodity price charts offer a wide range of data. For example, the Commodity Non-Fuel Price Index starts from 0.26 up to 10,067.17 for Olive Oil, Extra Virgin. This detailed information is key to understanding the market.
Commodity prices change a lot over time. For instance, natural gas prices dropped by -45.91%, but cocoa beans went up by 26.36% in a month. Over a year, rock phosphate fell by -52.71%, while cocoa beans jumped by 109.81%. This shows how prices can change, creating opportunities for trading.
Looking at future trends is also important. Energy prices are expected to go down by 3% in 2024 and 4% in 2025. On the other hand, natural gas prices have already decreased by almost 40%. Brent crude oil, however, is expected to get a bit higher in 2024 and then fall to US$79 per barrel by 2025.
Changes in agriculture commodities can be interesting too. Food prices might go down by 4% in early 2024, while beverages could go up by 22%. Then, beverage prices should level off in 2025. This information is useful for trading.
The change in food prices can impact many people. For instance, over 282 million people were struggling for food in 2023, compared to 100 million in 2018. Knowing these trends can help predict market moves and make better strategies.
Gold prices are at a new high because of global conflicts. Metal prices are expected to stay the same in 2024 but then rise steadily in 2025.
Understanding daily market changes is crucial. For example, wheat prices went up by 3% recently but dropped by -19% over the year. Corn had a 1% weekly increase but a -24% yearly decrease.
So, studying commodity price charts is key to doing well in trading. They help traders make choices based on solid data, keeping them competitive in the market.
| Commodity | Current Price | Previous Week Price | Weekly Change | Price 12 months ago | Annual Change |
|---|---|---|---|---|---|
| Wheat | 293 US$/t | 285 US$/t | 3% | 363 US$/t | -19% |
| Corn | 199 US$/t | 198 US$/t | 1% | 263 US$/t | -24% |
| Canola | 520 US$/t | 519 US$/t | 0% | 563 US$/t | -8% |
| Cotton | 86 USc/lb | 85 USc/lb | 0% | 94 USc/lb | -9% |
| Sugar | 18.8 USc/lb | 19.6 USc/lb | -4% | 25 USc/lb | -26% |
| Wool | 1,135 Ac/kg clean | 1,134 Ac/kg clean | 0% | 1,318 Ac/kg clean | -14% |
| Beef | 611 Ac/kg cwt | 606 Ac/kg cwt | 1% | 615 Ac/kg cwt | -1% |
| Mutton | 277 Ac/kg cwt | 252 Ac/kg cwt | 10% | 390 Ac/kg cwt | -29% |
| Whole Milk Powder | 3,350 US$/t | 3,269 US$/t | 2% | 3,089 US$/t | 8% |
Bar charts are key in trading. They show price changes visually. Each chart has several bars, giving a quick look at the market. I’ll explain bar charts and show how they are used in trading.
Knowing how bar charts work is important. A bar shows prices for a set time. It shows the opening, high, low, and closing prices. The bar’s length says how much prices changed. Long bars mean big changes, while short bars mean less change. This helps traders spot trends and decide when to buy or sell.
To read bar charts easily:
Bar charts work well in real examples. Looking at a 1-minute chart helps day traders. It shows fast price moves for quick decisions. But, a weekly chart suits long-term investors better. It highlights big price moves over weeks.
Imagine seeing an exhaustion bar at a buy signal’s end. Traders could sell their stocks or bet against the market. Also, spotting an inside bar warns about a calm market. It means traders should wait until the trend is clear.
Making good use of bar charts takes practice. You need to know how they’re made and what they show. Using them with current and past data makes trading smarter and informed.
Understanding advanced charting is vital for trading. I’ll talk about moving averages and trend lines. These tools predict how commodity prices might move, aiding traders in making smart choices.
Moving averages cover set periods like 10 days or 30 weeks, picked by traders. They often use the 200-day, 100-day, and 50-day simple moving averages (SMAs). A moving average can show a price’s support or resistance. Its angle tells us the trend: up for uptrend and down for downtrend.
Buy or sell signals come from moving average crossover points. A buy sign is when the 50-day SMA goes above the 200-day SMA. Selling is suggested by the price dropping below a moving average.
Simple moving averages (SMAs) and exponential moving averages (EMAs) are key. EMAs give more value to recent data. They use a multiplier to determine this. A 10-day EMA’s multiplier is 18.18%.
Trend lines help spot market trends. To create one, link at least two points on a chart. An uptrend line shows prices rising. A downtrend line shows falling prices. These lines mark support and resistance levels, crucial for guessing future prices.
Trend lines and moving averages work together well. They help traders see if a trend is likely to keep up or change direction. This combination makes for stronger trading strategies.
Understanding channels in price charts and market cycles is key for good trading. They help traders see the repeating patterns in prices. This knowledge is vital for understanding market trends.
Channels are lines around price movements, showing support and resistance. They can go up, down, or stay flat, showing different market states. Knowing these channels tells if the market is in a trend or range. Using the Commodity Channel Index (CCI) with channels adds more info. It can show when to buy or sell if the CCI crosses certain points.
Market cycles follow seasons, events, or shifts in the economy. Knowing where the market is within a cycle helps traders make smarter choices. The CCI helps spot when the market is overbought or oversold, showing its cycle phase.
Watching the CCI helps find new trends and changes in cycles. Moving from negative to positive CCI values can mean an uptrend, while the opposite might show a downtrend starting. Understanding these signs and cycles is crucial for goodtrading analysis.
| Commodity Channel Index (CCI) | Stochastic Oscillator |
|---|---|
| Unbounded oscillator | Bounded oscillator |
| Spot trends, identify overbought/oversold levels, signal divergences | Indicate overbought/oversold conditions within a range |
| Applied to any market including commodities | Primarily used in stock and forex markets |
| Measures difference between current price and historical average | Calculates based on closing prices over a certain period |
So, knowing channels in price charts and how market cycles work helps traders understand the commodity market trends better.
In commodity trading, knowing when to buy or sell is very important. Traders spot these signals in different ways. They look for certain patterns and use specific tools to find them.
Traders watch for key reversal patterns. These can show if the market’s trend is about to change. A double top shows a likely drop in prices, pointing towards a selling opportunity. But, a double bottom suggests prices may rise, indicating it’s a good time to buy.
The candlestick chart is a popular tool for spotting these signals. It shows shapes like triangles that tell about market mood. An ascending triangle might mean prices will go up, so it’s a good time to buy. In contrast, a descending triangle can signal prices going down, a time to sell.
Bollinger Bands® and the RSI are also key. Bollinger Bands® show if the market is too high or too low, helping traders decide when to buy or sell. The RSI looks at how quickly prices change. If it’s under 30, it’s a buy signal. Over 70, it’s a sell signal.
Mixing these with moving averages and volume indicators can help traders. Moving averages show the trend’s direction clearly. Volume indicators check if big money is moving the market. Together, these tools can guide traders to make smarter choices.
Understanding *futures market trends* is key for those who want to predict price changes. These trends help us see what’s affecting market dynamics, which is very important for making trading choices. Knowing about futures contracts and their effects on prices is vital.
A futures contract is a set deal to buy or sell a commodity later, at an agreed price. This happens at a future time. The Chicago Mercantile Exchange (CME) is a top place for these transactions. Traders get a better sense of how the market might change by understanding these contracts.
The Commitments of Traders Report (COT), put out by the Commodity Futures Trading Commission (CFTC), tells us how many futures and options are held. It’s great for seeing what different traders are thinking and doing.
The futures market’s actions can really show up on the commodity charts. For example, a jump in futures prices might mean prices are going up in the near market, too. This can make the chart look very positive. Also, looking at futures spreads can show us major market trends and their effect on charts.
Market actions show in chart patterns. Things like moving averages and trend lines help traders guess where prices might go. The agreed-on delivery prices in futures deals, along with delivery notices, also help understand market moves.
| Key Aspect | Details |
|---|---|
| Futures Spread | Profiting from the price difference between two futures contracts. |
| Delivery Price | Price agreed upon in the futures contract for asset delivery. |
| Commodity Swap | Derivatives contract to fix commodity prices, primarily for oil. |
| Warehouse Receipts | Documents proving stored commodities’ quality and security. |
| Documentary Collection | Trade goods method where goods’ title is exchanged for payment. |
For commodity traders, knowing about *futures contracts* is a must. It helps them find key points in the charts that show the trends. This can make their trading strategies better and help them make more money.
Learning about double tops and double bottoms is key for smart trading. These shapes warn us when trends might flip, perfect for choosing the right time to buy or sell. Getting good at spotting these patterns helps make a strong trading plan.
Double tops show up after prices have gone up for a while. They look like twin peaks on a chart, with the second one lower than the first. This drop shows the market might be tired, suggesting prices could fall soon. Waiting to see if the price really goes below a certain level is important. When this move happens with a lot of trades, that’s when we know for sure the pattern is real.
Double bottoms, on the other hand, form after prices have dropped for some time. These look like a ‘W’ on a chart. A breakout from the ‘W’ with a strong increase in price usually means good times are ahead. Traders use this to catch the wave up. Just like with double tops, seeing a lot of trading when the ‘W’ breaks confirms the pattern. Doing your homework on these shapes is key to trading success.
Commodity price charts show the prices of goods over time. They help traders by showing them past and current prices. This lets traders make smart choices.
These charts give traders info on price history, current market trends, and possible future prices. Knowing how to read price charts is key to trading well and understanding the market.
Charting methods have gone from drawing by hand to using digital software. This change offers more tools for detailed market analysis, such as moving averages and trend lines.
Things like wars, how much is wanted, and the time of year can change market trends. Knowing these can help traders plan their moves and strategies.
There are bar, line, and candlestick charts. Each one shows prices differently. They all help traders study market changes.
Looking at old prices helps traders spot market patterns and important price levels. It guides decisions on future trades. This info is key for understanding the market.
Live prices can be found on trusted websites and apps. These updates are vital for reacting quickly to changing market conditions.
Traders use all sorts of tools, from software to simple drawing. These tools are important for keeping an eye on the market and making wise trading plans.
To understand price changes, traders look at things like breakaway points and moving averages. These signs guide their trading strategies.
Bar charts show how a commodity’s price has changed over time. Learning to use them helps traders make informed decisions on when to buy or sell.
Moving averages are the averages of prices over time. Trend lines are lines that connect prices to show the general direction. Both are used to predict where prices might go next.
Channels show a commodity’s typical price range. Cycles show regular price changes. Knowing these can help traders guess where the market is going.
Buy and sell points are spotted through technical signs in the charts. This know-how is very important for making the right trades at the right time.
Future trends are big for analysing commodities. They give a look into where the market is headed. What happens with future contracts can impact price charts and market guesses.
Double tops and bottoms signal a possible change in direction in the market. Spotting them is important for making good trading choices.