Carbon emissions in agriculture are only around 5% of the total. Most emissions are from sources like nitrous oxide and methane. These mainly come from the way we manage our soil and our livestock. Understanding these numbers has made me realise the big role every choice plays in shaping our farm’s impact.
In looking at my farm’s carbon footprint, I aim for a smart balance. It’s about cutting our impact on the climate while also meeting customer demands for eco-friendly goods. Keeping precise records of everything we do is key. This includes emissions directly from our activities, the electricity we buy, and the creation of basic supplies like fertilisers and feed.
Knowing the weight of our animals, the yields of our crops, and how much fertiliser and energy we use is crucial. This data helps us figure out the exact emissions, like methane from animals and nitrous oxide from crops. With the help of trusted methods like the National Greenhouse Account Factors, we can make sure our farm is moving in a sustainable direction.
Agriculture releases gases like nitrous oxide, methane, and CO2. These make up a big part of what we call a carbon footprint. Around 5% of the world’s farm emissions are CO2 related. This comes from things like how we manage soil, cow systems, and the fuel we use.
Keeping an eye on this footprint is key. It helps us figure out where these emissions come from. And then, we can plan how to cut them down.
Coton Wood farm is a good example. It shows 4,803.79 tonnes of CO2 equal per year in its carbon footprint. Per hectare, that’s 15.7 tonnes. This shows us how much impact the farm has on the environment.
When they look at their milk production, they use 0.96 kg CO2e per litre. This is a good rate compared to the general 1.25 kg CO2e. So, they have a strong focus on making their milk eco-friendly.
At Coton Wood, 80.31% of emissions are linked to their animals and the food they eat. The food itself makes up 18% of this. By improving how they look after the animals, the farm can reduce its emissions. Also, farming over more land can help balance out these emissions.
Using tools like Agrecalc can really help farms reduce their carbon footprint. Farms that have lower footprints tend to be more efficient and use resources better. This shows us that modern farming methods and technology are key to cutting emissions.
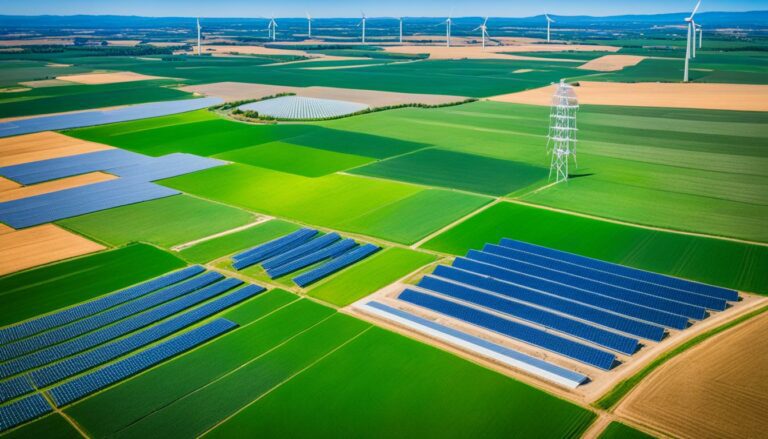
Adding trees and cover crops helps take out carbon from the air. Using renewable energy and farming methods like moving livestock from one field to another can also lower emissions. This reduces the pollution going into our soil and water.
| Farm | CO2e per Year | CO2e per Hectare | Average CO2e per Liter of Milk | Livestock Emissions | Feed Contribution to Emissions |
|---|---|---|---|---|---|
| Coton Wood | 4,803.79 tonnes | 15.7 tonnes | 0.96 kg | 80.31% | 18% |
Managing the way we move farm products can also lower emissions. So can finding ways to waste less food. Moreover, new tech like carbon capture and storage can play a big role in trapping CO2.
So, knowing and tracking our carbon footprint is crucial. It’s not just about cutting down on emissions. It’s about making farming a part of the solution to climate change. By doing this, farms can help fight against climate change.
It’s key to know where emissions on farms come from for correct farming carbon emissions measurement. Mainly, emissions come from livestock, crops, and the use of fuel and electricity.
Sheep and cattle make a lot of farm emissions, especially through methane. Enteric fermentation in their stomachs causes this. Beef cattle make up most of this, with dairy cattle also contributing. How farmers handle manure affects nitrous oxide emissions too, which matters for the agricultural carbon footprint calculation.
Nitrogen-rich fertilisers and plant changes are big sources of emissions from crops. These practices boost crop growth but also lead to more greenhouse gases. Turning woodlands into farmlands can add to carbon dioxide in the air.
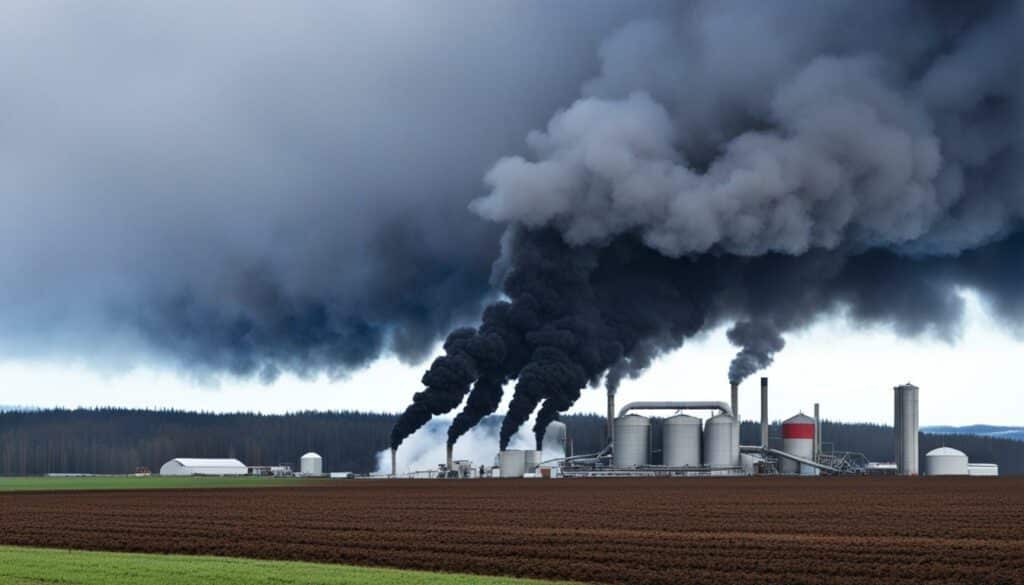
Diesel and electricity use are significant in farming carbon emissions measurement. Fuel for tractors and other machines, plus farm electricity, adds a lot of CO2 to the atmosphere. Although less than 1% of electricity comes from petroleum, these uses are still important for emissions.
| Source | Emission Type | Contribution |
|---|---|---|
| Beef Cattle | Methane | ~75% of livestock emissions |
| Dairy Cattle | Methane | ~20% of livestock emissions |
| Nitrogen Fertilisers | Nitrous Oxide | High emission factor through soil application |
| Diesel Use | Carbon Dioxide | Significant in machinery operations |
To get the real agricultural carbon footprint, farms need to consider emissions from all major areas. This way, farmers can really see their environmental effect and strive for a better future.
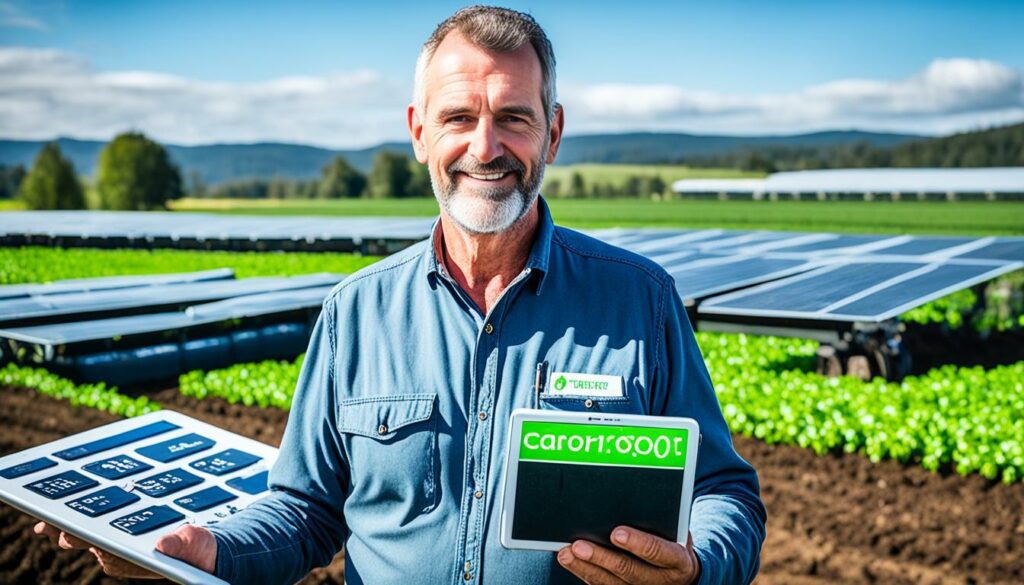
When it comes to figuring out how much carbon farms actually produce, we need special *agricultural carbon footprint calculation* tools. These tools are vital. They let farmers see how much they’re emitting. This knowledge is key to adopting practices that are good for the planet.
Farmers use these *carbon footprint monitoring in agriculture* methods to track their major emission sources. They then work out how to reduce these harmful emissions.
The Greenhouse Accounting Framework (GAF) is a top tool. It was crafted by the Primary Industries Challenge Centre and the University of Melbourne. It follows Australia’s greenhouse gas inventory rules. Users enter data into Excel sheets for careful analysis.
The Cool Farm Tool is another useful device. Unilever, the University of Aberdeen, and the Sustainable Food Lab worked together to create it. This tool not only measures emissions. It also estimates how much soil can trap carbon based on global findings. Both tools improve how farmers perform *carbon footprint monitoring in agriculture*.
Getting farm emission numbers right relies on collecting detailed data. Key data points cover various aspects of farming, from animal weights to crop yields.
This data is crucial for pinpointing emission sources like methane from animals and nitrous oxide from manure. With the right information and tools at hand, farmers can effectively cut down their carbon footprints.
It’s key to know about different emission types for a detailed sustainable farming emissions check. These come under Scope 1, 2, and 3. They cover different sources and need different plans to cut them down.
Direct emissions from farming are Scope 1. This includes methane from animals and nitrous oxide from fertilised soil. It also involves fuel burn in on-farm vehicles.
Scope 2 emissions are indirect, coming from bought electricity use. This means the emissions from making the electricity used in buildings, lights, and irrigation systems. Even though not direct, they’re crucial for the total emission count.
Scope 3 covers the widest activities and comes from indirect sources. These are not owned or directly controlled by the farm. It includes emissions from bought products and services. Fertilisers, herbicides, and vet services are examples. Scope 3 often forms the biggest part of a farm’s emissions. And reducing them is quite tough.
To evaluate the farm’s greenhouse emissions fully, knowing about these scopes is crucial. Working with suppliers and customers helps reduce Scope 3 emissions. This supports farming that’s more eco-friendly.
It’s key to know the main data for a good farm eco-footprint check. This means detailed and accurate data are vital. They build the base for checking and cutting a farm’s emissions.
The amount of livestock and how much they weigh affect a farm’s carbon print. Animals, mostly ruminants, make a lot of methane in their stomachs. Knowing the numbers and weights helps work out this methane part of the farm’s footprint.
Growing crops and using fertilisers add to nitrous oxide. It’s important to track what crops give and what fertilisers, how much, and how often. It helps see the farm’s impact better and find ways to farm cleaner.
Using fuel and electricity makes farms release carbon dioxide. So, keeping an eye on fuel from machines and cars, and how much electricity the farm uses is a good idea. It helps find ways to use less energy, making the farm’s footprint smaller.
| Data Points | Impact on Emissions | Key Considerations |
|---|---|---|
| Stock Numbers & Weight | Methane emissions from enteric fermentation | Accuracy in livestock records |
| Crop Yields & Fertilisers | Nitrous oxide from fertiliser application | Details of fertiliser usage and crop type |
| Fuel & Electricity | Carbon dioxide from fuel and power use | Monitoring consumption levels |
Looking closely at these data points helps farmers check their eco-footprint well. This leads to healthier, more earth-friendly ways of farming.
Using carbon calculators is key for measuring farming carbon emissions. They help estimate emissions accurately and steer farms towards sustainability. The Greenhouse Gas Framework Tool and the Cool Farm Tool are great options. They are easy to use and have special features.
The Greenhouse Gas Framework Tool is designed in Microsoft Excel. It perfectly follows the Australian National Greenhouse Gas Inventory (NGGI) methods. It’s great for adding lots of data, such as stock and crop amounts, and fuel use. This tool is perfect for detailed carbon tracking and insights on emissions.
The Cool Farm Tool works online and is very flexible. It lets farmers input lots of different data and considers soil’s role in capturing carbon. Its approach to measuring carbon from farms is thorough. This tool is good for combining many data sources to show the full picture of carbon use. It helps farmers understand their data better and plan for reduced carbon use.
Both the Greenhouse Gas Framework Tool and the Cool Farm Tool are crucial for farming’s carbon tracking. They fit the farmers’ unique needs. The first one sticks to national standards, and the second uses a vast data pool. Using these tools, farmers can not just measure but also improve their farms’ sustainability by reducing carbon footprints.
Looking for the best carbon footprint assessment for farms, I found 64 tools. Nine were closely examined, but only three were ideal for farms in Scotland: AgRE Calc, Cool Farm Tool, and Solagro (JRC) Carbon Calculator. Notably, no single tool covered all emission reduction aspects on farms.
The tools for farm eco-footprint analysis shared a common way to calculate. However, they didn’t include emissions from buying livestock. But still, they helped in assessing the carbon footprint at farm-level. The table below shows a deep comparison of these tools’ main features and costs:
| Tool | Users | Key Features | Membership Cost |
|---|---|---|---|
| Cool Farm Tool | 10,400 (mostly arable sector) | Calculates by crop/livestock type, identifies improvement areas | £1,563/year for small businesses |
| Farm Carbon Calculator | 2,500 (new version) | Expresses farm’s annual footprint in CO2 equivalent, IPCC-based | £3,500/year for consultants |
| Agrecalc | N/A | Whole-farm, product, and enterprise breakdowns | N/A |
Each tool had its own special features. For example, Agrecalc could do a whole farm analysis. On the other hand, the Cool Farm Tool could look at your farm crop by crop or animal by animal but was not detailed enough for farms growing only grass. The different levels of details and how easy they are to use show why it’s key to pick a tool that fits your farm’s needs. This helps show the true carbon footprint of a farm. And it helps in making climate-friendly choices.
Reducing farm emissions is key for the environment. Strategies, from managing animals to better crop practices, can help. Each step is important. It includes taking care of animals, changing how crops are grown, and using less fuel and energy.
Livestock play a big role in greenhouse gases from farms. Giving animals the right food helps reduce a type of methane. Special supplements also lower the amount of methane animals produce. Using special facilities to manage waste can cut down methane too. They make biogas for energy use, but they might cost a lot to set up.
How crops are grown affects emissions a lot. Methods like conservation tillage and using cover crops help keep carbon in the soil. They also lower the amount of some harmful gases. Using less artificial fertiliser by picking the right plants can also help. Nearly half of America’s farm emissions come from fertilisers and waste.
Using fuel and energy efficiently is crucial for lessening farm emissions. About 6% of farm emissions in the U.S. come from the fuel it uses. Using new, cleaner energy and better machines can help. For example, drones can make using fertilisers more efficient. This cuts down emissions even more.
Reducing the carbon intensity (CI) of crops brings big benefits, especially today. It helps a lot with the environment and creates more income for growers.
Growers can make more money if they lower their CI scores. By using better nutrients and farming practices, they can meet the rising demand for eco-friendly products. In Iowa, the TopSoil system has an average CI score of 8 for corn. This is much better than the national average of 29.1.
Every point dropped in the CI score means more cash, around $0.054 extra for each bushel. Since usual corn scores about 29.1 CI, a good reduction can really boost earnings. Going below the national average can get you higher prices, even up to a 20% premium for your low-carbon corn.
There are laws that push ethanol makers to buy gentle on the planet corn. Corn used for ethanol is a big deal in making green jet fuel. The goal is to use only green jet fuel by 2050, cutting emissions by half. This move benefits growers of eco-friendly corn a lot.
If your corn’s CI score falls below 29.1, ethanol makers might pay you an extra 5.4 cents per bushel. A perfect score could even get you $1.57 more per bushel or about $345 more for every acre just in tax breaks. Growers could also get a $70 bonus per acre for offering corn with low carbon intensity.
These perks show why measuring your farm’s carbon footprint is so crucial. Farmers who focus on being green are not just good for the planet. They also make more money because their crops match what buyers want – sustainable and eco-friendly.
| Factors | Impact |
|---|---|
| National Average CI Score | 29.1 kg CO2E/mmBtu |
| TopSoil Average CI Score | 8 kg CO2E/mmBtu |
| Value per CI Point Reduced | $0.054/bushel |
| Tax Credit Value Per Bushel at 0.0 CI Score | $1.57 |
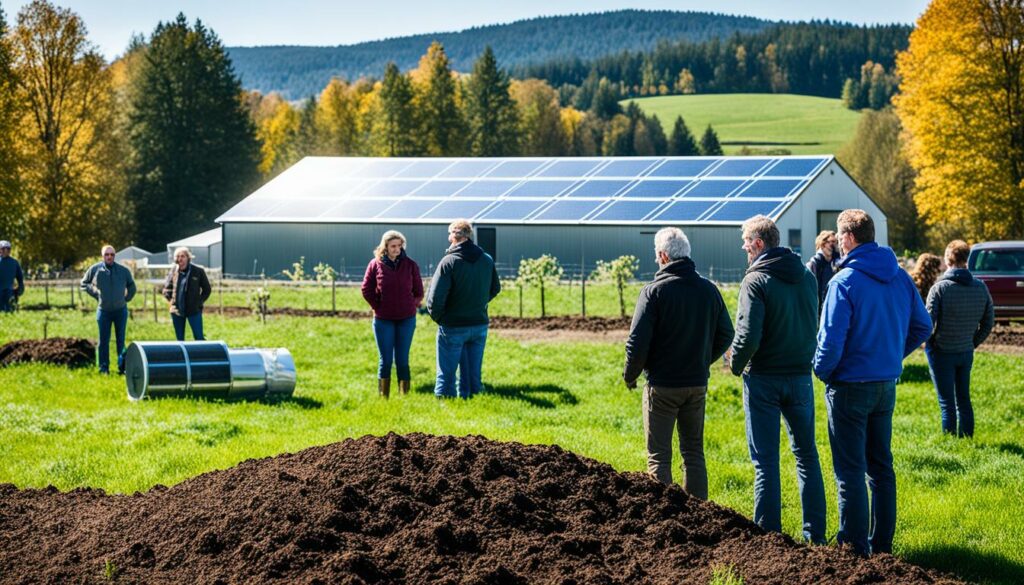
To cut down on farming emissions, we need smart plans. Encouraging soil to keep more carbon and handling manure well are key. These steps help shrink agriculture’s carbon footprint a lot.
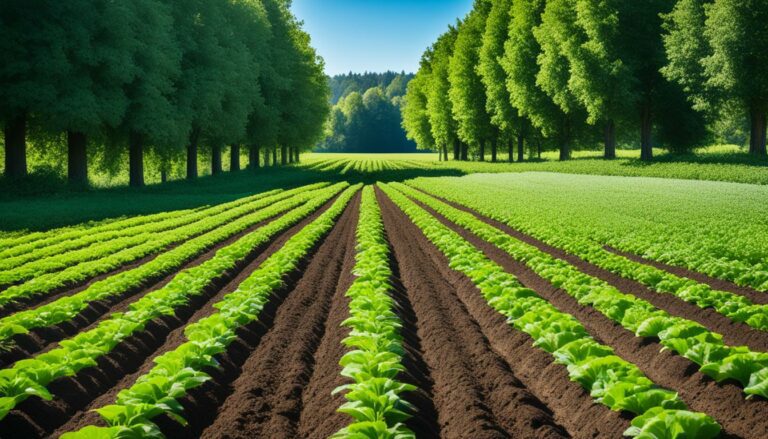
Storing more carbon in the soil is a big way to fight climate change. Methods like planting cover crops and not tilling as much are important. Adding organic matter to the soil through these ways makes soil healthier and traps carbon.
Managing manure carefully cuts nitrous oxide emissions. Using manure smarter can reduce the loss of nitrogen. This helps lower the carbon footprint of farming. Composting and timing manure use avoid more emissions. They also make nutrients on the farm work better.
These steps can really help but face challenges in use by all farmers. Tech, money, and changing how we do things can be tough. And, we might find it hard to know exactly how much we’re cutting emissions. Yet, we should keep pushing because the good they can do is clear.
| Challenge | Impact |
|---|---|
| Technological and economic knowledge barriers | Hinders adoption by farmers and ranchers |
| Social and behavioural barriers | Limits acceptance of new practices |
| Measurement uncertainty | Complicates impact estimation of mitigation activities |
| Baseline uncertainty | Challenges in establishing lower-GHG practices |
| Additionality | Difficulty in assessing policy-induced changes |
The USDA helps with support from programs like CRP, CSP, and EQIP. These programs and others push for farming that’s better for the climate. They make it easier to cut emissions, leading to a greener agriculture.
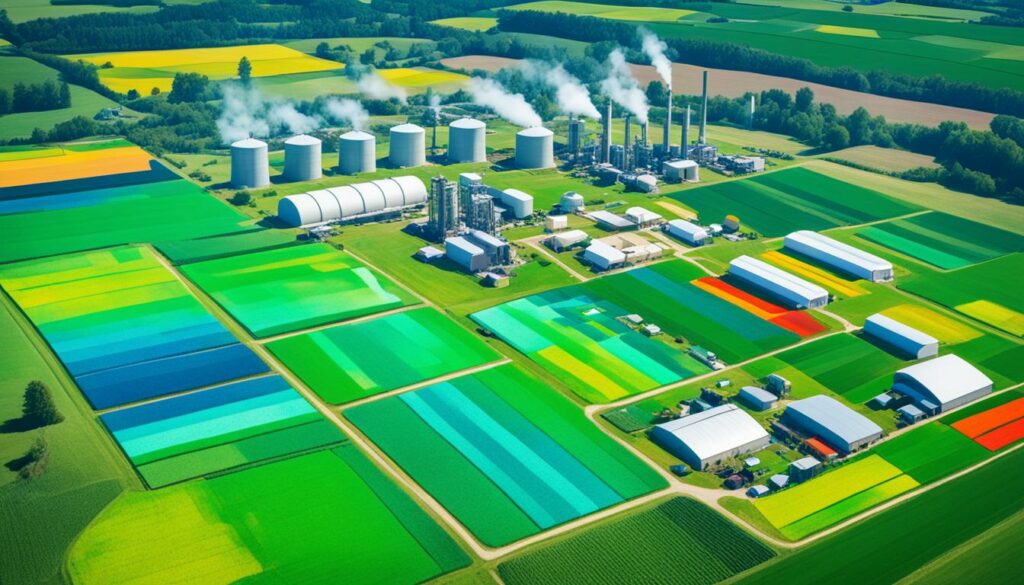
It’s become more vital to track farm eco-footprint analysis closely. This is because farming makes up about 25 percent of all greenhouse gas emissions. New tools like KGML-ag are making it easier to measure farming’s carbon emissions accurately and much faster.
AI-CLIMATE researchers from various fields are joining forces. They’re looking at how the KGML framework can help in both farming and forestry. By using satellite data and a special approach, they’re getting better at measuring farm eco-footprints.
The team’s work is backed by the ARPA-E SMARTFARM project. This project brings together experts from the University of Minnesota and UIUC. Together, they’re showing how technology can change the way we understand farm eco-footprints. For example, new CO2 sensors make it easier to collect data in rivers and streams. This is especially useful in places like New Hampshire, with 19,000 miles of waterways. Researchers can use these sensors to measure pCO2, which helps them understand farming’s carbon emissions better.
Researchers are also upgrading sensors to study CO2 emissions in more detail. They’re shifting sensors from measuring CO2 in oceans to streams. This change helps them understand how severe weather affects emissions.
Almost half of the methane in small streams goes through a process that helps reduce greenhouse gases. All these new methods add up to a stronger way of understanding farm eco-footprints and carbon emissions.
| Technique | Description | Impact |
|---|---|---|
| Real-time Sensor Networks | Monitors soil carbon levels continuously | Enhances accuracy in eco-footprint analysis |
| Satellite Imagery | Assesses land use changes | Provides a broad perspective on emissions |
| Complex Modelling Software | Simulates management scenarios | Forecasts the climate impact effectively |
Advanced technology is changing how we measure and manage farm emissions. By looking at two technologies closely—robotic milking systems and automated livestock feeding, we can see how they’re making a difference. They’re key in reducing emissions on a farm.
Robotic milking systems are more efficient than manual ones. They use more electricity at first, but this is balanced by their efficiency. Machines can feed cows accurately and make them more comfortable, which lowers their methane output. This helps to lessen the farm’s overall greenhouse gas emissions.
Automated feeding is precise and cuts down on waste. This precision lowers costs and is a big deal in measuring carbon emissions in farming. It means animals get the right amount of food, cutting down on wasted nutrients and reducing the farm’s carbon footprint. Better feeding also means healthier and more productive livestock. This contributes to a greener way of farming.
Both technologies greatly cut emissions and make farms more efficient. Studies show that using these innovations is a key step in tackling emissions in agriculture. They’re essential for a sustainable future.
| Technology | Key Benefits | Emissions Impact |
|---|---|---|
| Robotic Milking Systems | Improved efficiency, reduced stress on livestock | Decrease in methane emissions |
| Automated Livestock Feeding | Precise feed delivery, reduced waste | Lower overall carbon footprint |
Switching to these tools is crucial in the fight against climate change. The link between CO2 and economic growth remains strong. This shows why we need to use these new technologies. They are vital for eco-friendly farming.
It’s key to understand the outcomes of a green farming emissions check. This helps spot where the emissions are coming from. It allows for a close look at emissions from every farm activity. I can see how my farm is doing compared to others.
At Coton Wood, animal emissions are the main cause, making up 80.31% of the total. This includes a lot of methane from animals. Plant growth and the things we use are also important contributors. The farm’s overall carbon balance is 4,803.79 tonnes of CO2 each year. This means 15.7 tonnes of CO2 for every hectare.
Here is a quick look at where the emissions come from:
| Emission Source | Percentage of Total Emissions |
|---|---|
| Livestock | 80.31% |
| Crops and Inputs | 19.69% |
Looking at year-to-year changes is a big step. It helps see if new ways of managing animals cut methane. Or if different planting methods reduce nitrous oxide. This info is vital for improving the farm’s eco-friendly practices.
Watching these changes can show what works. It also spots issues, like weather changes, that might affect the gases we produce. Doing this each year means we can keep getting better at being sustainable.
Understanding carbon footprint data helps manage farms better. It’s key for lessening emissions and moving towards sustainability. By knowing where emissions come from and sorting them out, I can work on strategies to decrease the farm’s impact. It all starts with gathering detailed info on things like how much crops grow, and how I use energy.
To cut emissions, I need to get the carbon footprint right. Tools like the Greenhouse Accounting Framework and Cool Farm Tool show where I need to make changes. Making adjustments to how I handle animals and their waste can reduce harmful gases. I also need to farm smarter, using just enough fertilisers and herbicides to stop pollution.
Bringing in carbon footprint data can make the farm more sustainable. Changing to clean energy and using diesel better are big steps. Plus, farming smarter helps and gets us closer to climate goals. This all-round approach helps the farm be active in fighting climate change.
By using carbon footprint info well, farmers can be more eco-friendly. Doing this not only helps the planet but can bring in money. It meets the growing demand for sustainable food without hurting the earth.
Start by collecting data on livestock, crops, fertiliser use, and energy. Use tools like the Cool Farm Tool. They help work out how much carbon your farm is emitting.
Knowing your farm’s carbon footprint is key. It helps find where you’re emitting the most and how to be more sustainable. It also meets the demand for eco-friendly products and can get you tax breaks.
Farms mainly emit methane from animals, nitrous oxide from fertilisers, and CO2 from energy use. These come from cows, crops, and the equipment we use.
Carbon calculators use your farm’s details to see how much carbon you produce. They let you test different ways to reduce this. This helps you keep an eye on and cut your farm’s carbon footprint.
Scope 1 emissions are from your farm directly. Scope 2 comes from what you buy like electricity. Scope 3 are from outside but because of what you use, like fertilisers.
You need details about your animals, crops, fertilisers, and energy used. This info helps calculate the gases your farm produces. It’s key for knowing your farm’s impact.
The Greenhouse Gas Tool works with an Australian method and is in Excel. The Cool Farm Tool is online and considers the carbon the ground absorbs. Both are good for working out and managing farm emissions.
Carbon calculators differ in what they need and show. Choose one that fits your farm’s details and how deep you want to look into it.
To cut down, update how you manage animals and crops. Make sure to use energy wisely. For example, change what you feed animals to lower their gas output. Choosing how you farm can keep more carbon in the ground.
By cutting your carbon score, you might get tax benefits. Also, you can make more money from eco-friendly products. This improves your farm’s finances and how it’s seen by the market.
To lessen emissions, work on keeping carbon in the ground and handling manure better. Also, use natural materials in the soil with tactics like planting cover crops.
Tools like sensors for the soil and satellites for checking the land can help. There are also computer programs to predict how your farm’s choices affect the climate.
New tech in farming, like machines that milk and feed animals, can make things better. Yet, they may use more power. They improve how we feed animals, making them happier and less gassy.
Looking at emissions per area or product gives a clear picture. Keep track each year. This shows if what you’re doing is working and how things like the weather affect your farm’s carbon output.
This data is a guide to make your farm greener. It helps pick the best crops, use the right amount of fertiliser, and smartly manage how and where you use energy. This makes your farm kinder to the environment.